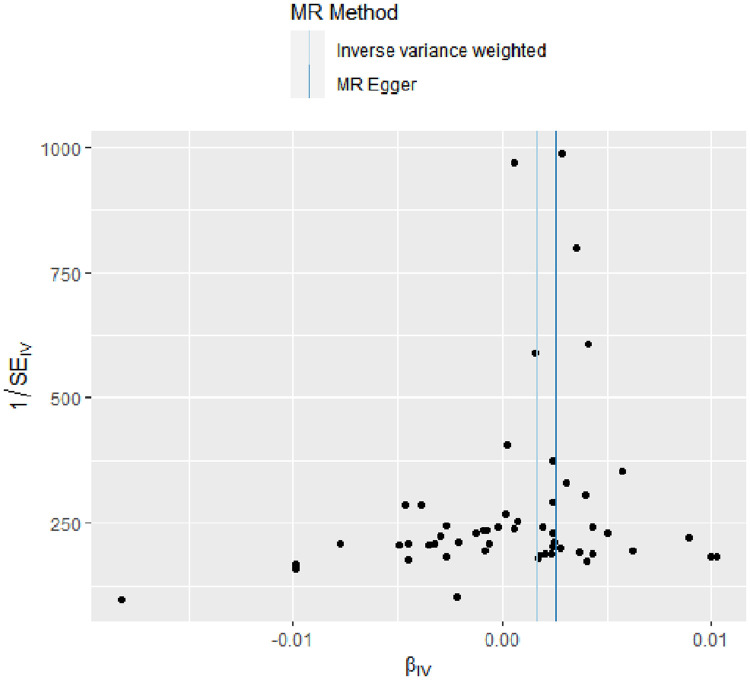
Figure 4.
Funnel plot for RA on coronary atherosclerosis. This plot can be used for visual inspection of symmetry, where any deviation can be suggestive of pleiotropy. Each SNP's MR estimate is plotted against its minor allele frequency corrected association with RA. We note that our plot appears generally symmetrical. SNPs, single nucleotide polymorphisms. MR, Mendelian randomization; RA, rheumatoid arthritis.

