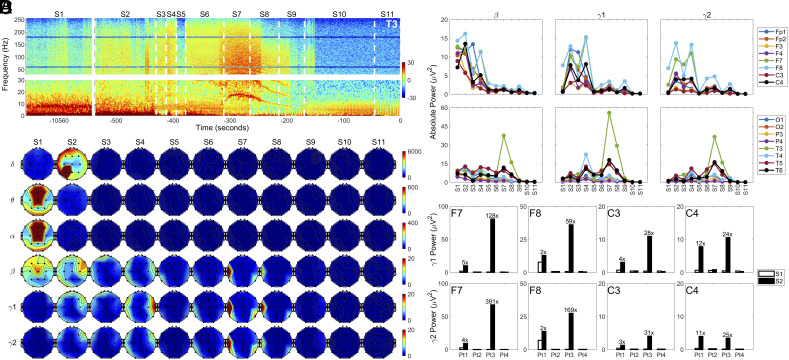
Fig. 1.
Global hypoxia-induced surge of high-frequency oscillations in the brain of dying patients. (A) Absolute power of left anterior-mid temporal lobe (T3) before (S1) and after (S2 to S11) the withdrawal of ventilatory support in Pt1. The power spectrogram was presented in two separate parts (Bottom: 0 to 30 Hz; Top: 30 to 256 Hz) to highlight potentially unique features in slow waves (delta-beta). (B) Spatial and temporal dynamics of absolute power at baseline (S1) and at near-death stages (S2 to S11) in six frequency bands: delta (0 to 4 Hz), theta (4 to 8 Hz), alpha (8 to 13 Hz), beta (13 to 25 Hz), gamma1 (25 to 55 Hz), and gamma2 (80 to 150 Hz) in Pt1. (C) Temporal changes of beta, gamma1, and gamma2 power in 16 EEG loci (excluding the midline areas covered by Fz, Cz, and Pz electrodes) in Pt1. (D) Gamma power in four cortical regions (F7, F8, C3, and C4) in the four patients at baseline (S1) and after the termination of breathing support in S2.

