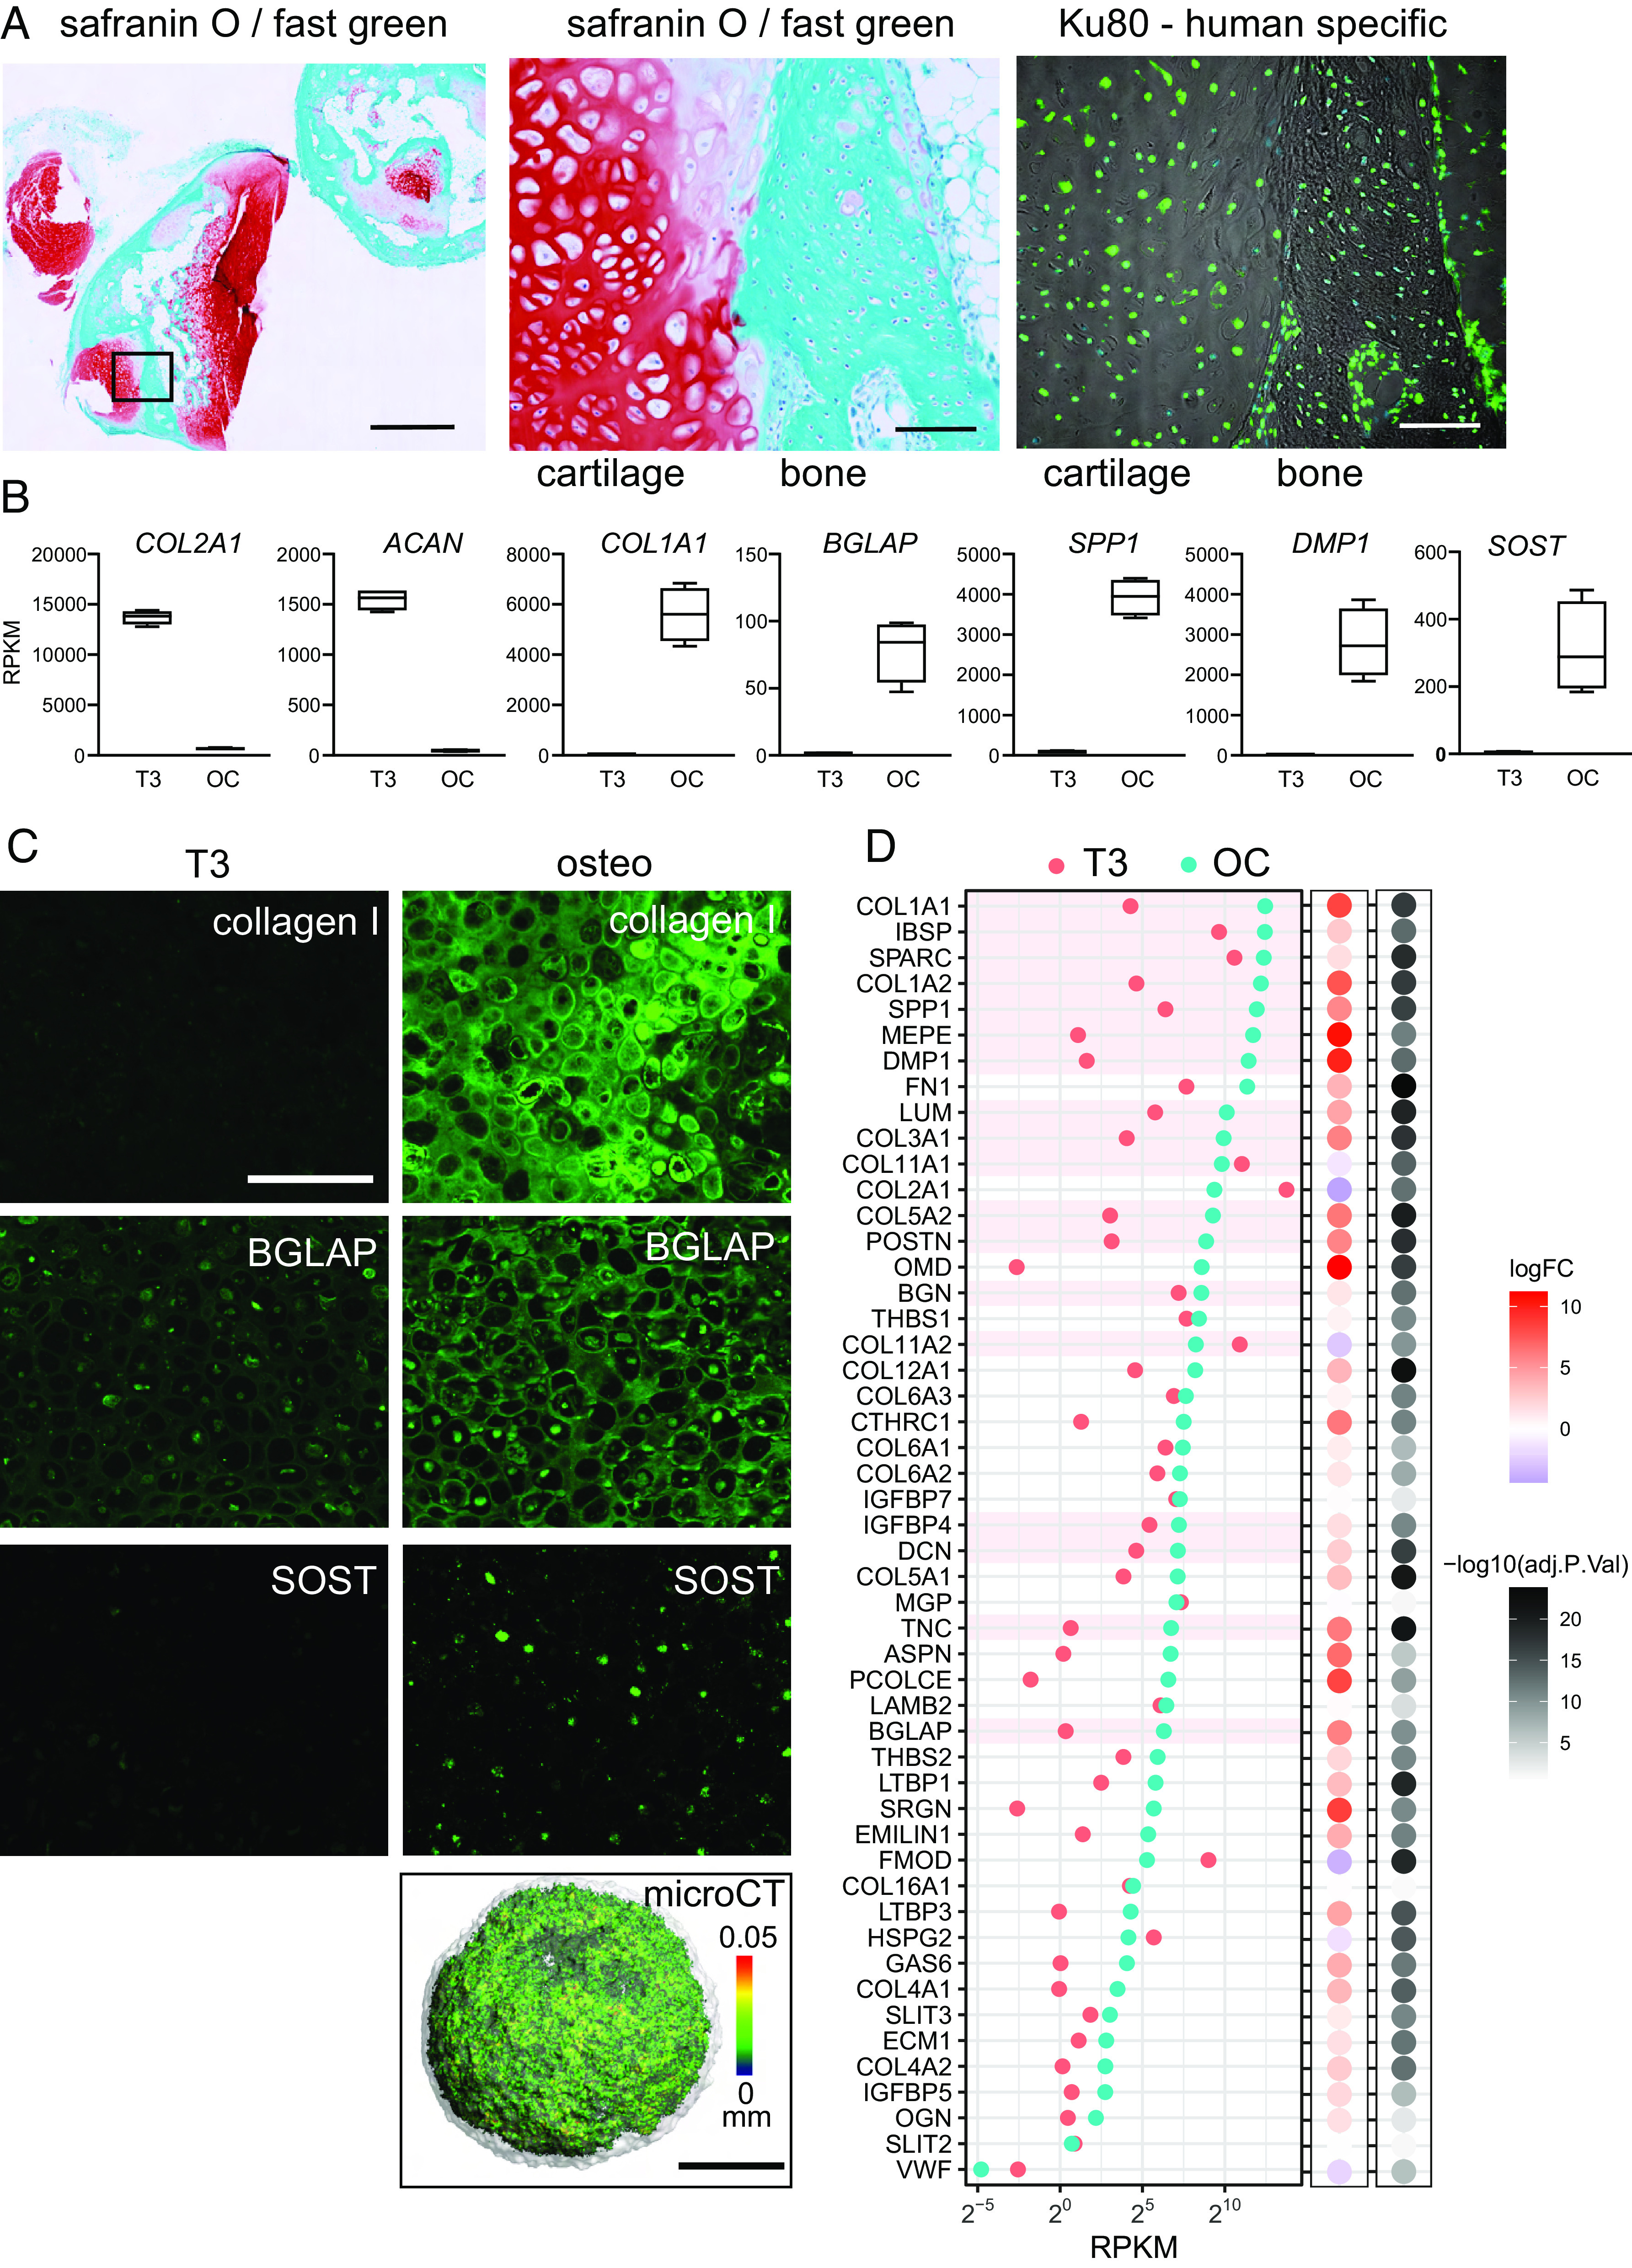
Fig. 2.

Hypertrophic chondrocytes can transition to osteoblasts. (A) Transdifferentiation in vivo. The iPSC line MCRIi001-A-BFP was differentiated to cartilage and then treated with 10 nM T3 for 7 d from day 35. At day 42, hypertrophic chondronoids were implanted subcutaneously into immunocompromised mice and harvested after 13 wk. Implants were decalcified and then sectioned and stained with safranin O for cartilage proteoglycans and fast green to highlight bone. Scale bar on left-hand image is 1000 µm. The box shows the region enlarged in the middle image. The image on the right shows the same region from an adjacent section immunostained with a human-specific Ku80 antibody. Scale bars on middle and right images are 100 µm. (B) Hypertrophic chondrocyte-to-osteoblast transition in vitro. From day 38, MCRIi018-B chondronoids were treated with 10 nM T3 for 14 d (T3) and then transferred to osteogenic medium for a further 3 wk (OC). Abundance (RPKM) of mRNA for cartilage genes COL2A1 and ACAN declines, and mRNA for osteoblast/osteocyte genes COL1A1BGLAPSPP1 DMP1, and SOST is significantly more abundant in osteogenic organoids. (C) Immunostaining shows collagen I and BGLAP deposited in the ECM in osteogenic organoids. Cells also express the mature osteocyte marker SOST (Scale bar is 200 µm.). The osteogenic organoid ECM is mineralized [microCT, (Scale bar is 500 µm.), color scale indicates mineral structure size]. (D) The 50 most highly expressed core matrisome genes in osteocytes isolated from mouse tibia (51) and their relative average expression in iPSC-derived hypertrophic chondronoids (T3) and osteogenic organoids (OC). N = 4 parallel differentiations. The 18 most highly expressed genes in vivo are highlighted in pink for comparison.
