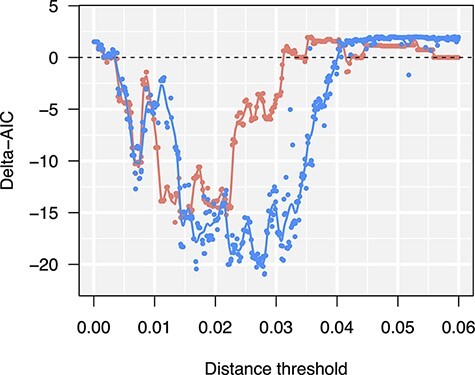
Figure 2.

ΔAIC profiles for connected component (red/non-blue) and Markov clustering (MCL, blue) methods under a range of Tamura–Nei (TN93) distance thresholds. More negative ΔAIC values indicate less information loss when incorporating additional predictor variables into a Poisson regression of new nodes among clusters (Chato, Kalish and Poon 2020). Each point represents one of 420 parameter combinations, specifically the distance threshold ( ) and the expansion (k) and inflation (r) parameters of the MCL method. Solid lines correspond to cubic smoothing splines fit to each set of points.
