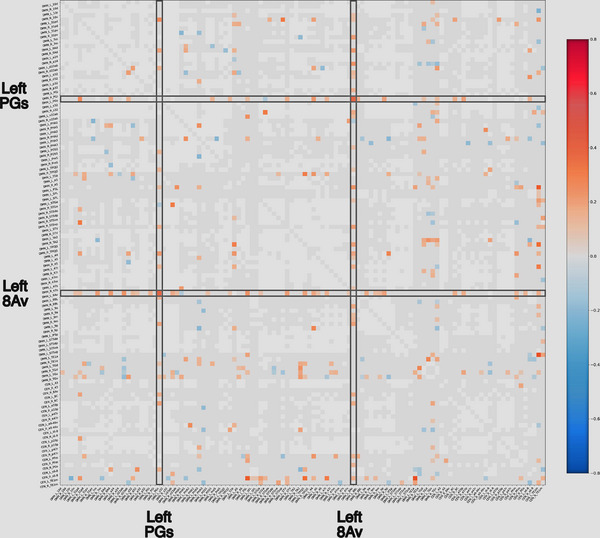
FIGURE 1.

Anomalous functional connectivity matrices. Anomalous functional connectivity matrices for the Default Mode Network (DMN) and Central Executive Network (CEN) based on functional connectivity data for two patients in our cohort. Targets were generally represented by columns demonstrating multiple anomalies in functional connectivity with intra‐ and internetwork connectivity. Light gray squares are considered to be functioning normally when compared to a normal dataset, and white squares are areas that are highly variable, and are thus excluded from the analysis. The chosen targets for treatment are highlighted by gray boxes. If an area showed mostly hyperconnectivity with other areas, we used continuous theta burst stimulation on the hypothesis that it generally induces cortical depression and we chose intermittent theta burst stimulation for areas which generally displayed a majority of anomalies which were hypoconnected to other parts of these networks. The prescribed treatment protocol for this patient was continuous theta burst stimulation of left 8Av and left PGs.
