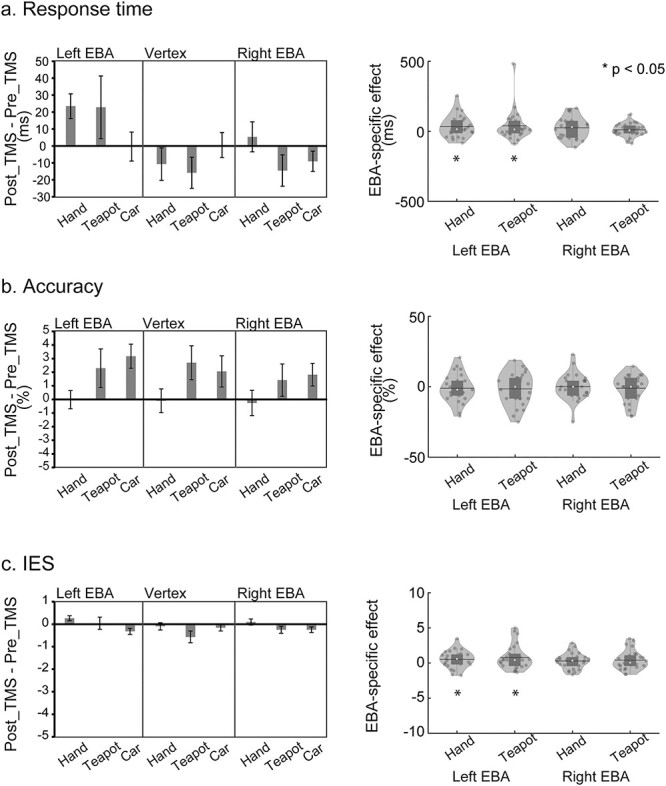
Fig. 3.

Visual hand and teapot effects bar graphs (left) indicate the intervention effects (post_TMS − pre_TMS phases) of the visual task. The inhibition after the rTMS application was indicated by positive values in RT a) and IES c) and by negative values in accuracy b). Cars were used as control objects. Error bars indicate SEM. Violin and boxplots on the distribution of EBA-specific hand effects and teapot (tool) effects are shown (right). Each dot represents the individual participant’s data. The white circle, horizontal line, and bar indicate the median, mean, and box plot, respectively. Asterisks indicate the results of 1-tailed 1-sample Wilcoxon signed-rank test.
