
Fig. 4.
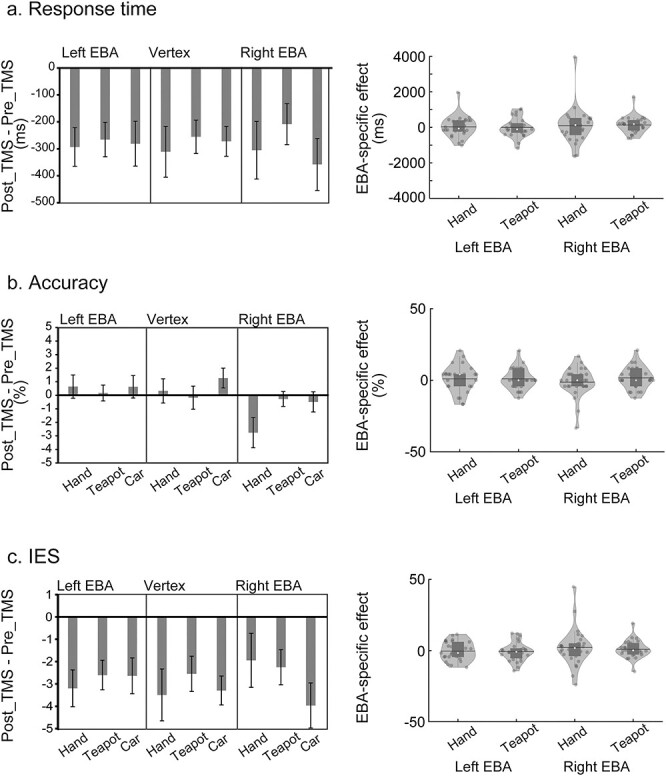
Haptic hand and teapot effects bar graphs (left) indicate the intervention effects (post_TMS − pre_TMS phases) of the haptic task. a, b, and c) indicate RT, accuracy, and IES, respectively. Error bars indicate SEM. Violin and boxplots (right) show the distribution of EBA-specific hand and teapot effects. No significant effect was observed.