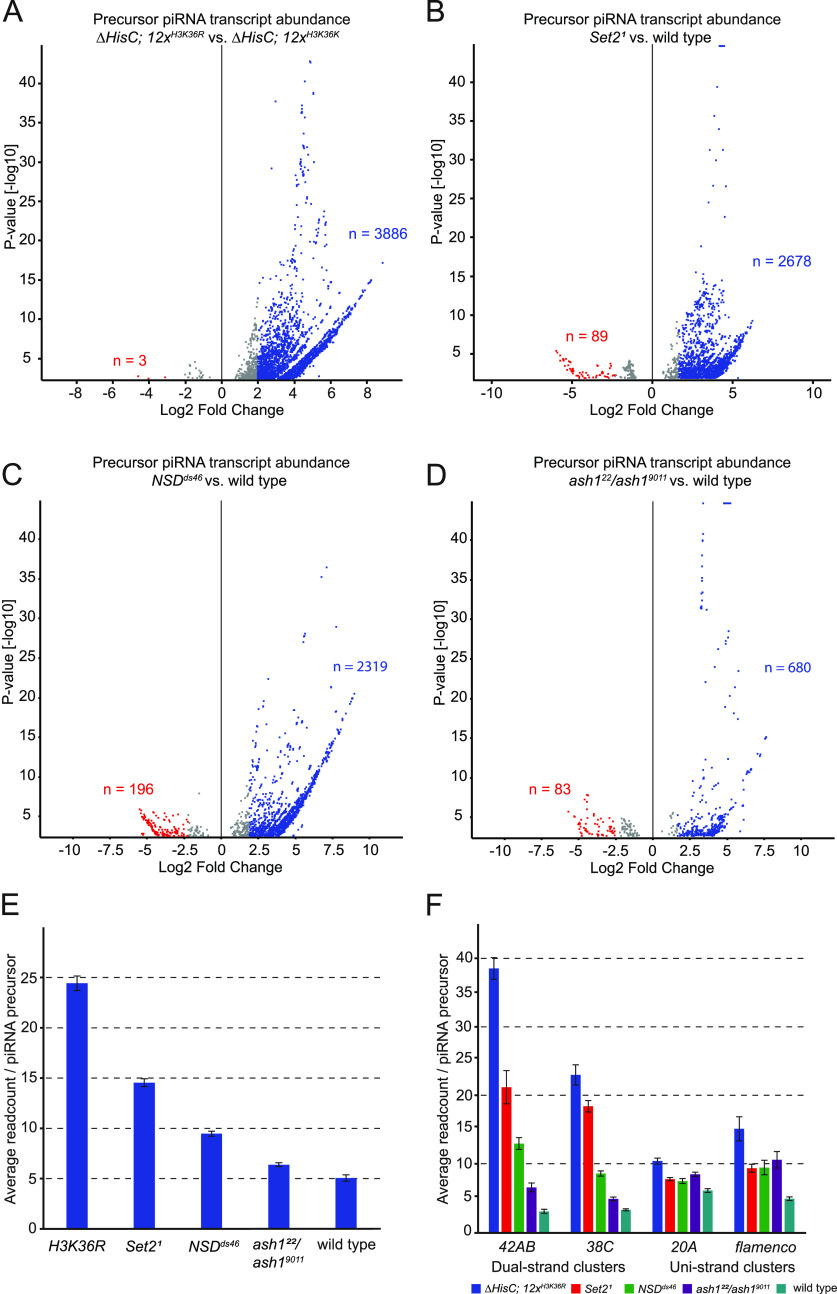
Figure 3. Dual-strand piRNA clusters are activated in the absence of H3K36 methylation.
(A) Volcano plot showing differential transcription of piRNA precursors between ∆HisC; 12xH3K36R and ∆HisC; 12xH3K36K. Shown in blue are 3,886 piRNA precursors being up-regulated by log2 fold change >2 (P < 0.05). (B) Volcano plot showing differential transcription of piRNA precursors between Set21 and wild type. Shown in blue are 2,678 piRNA precursors being up-regulated by log2 fold change >2 (P < 0.05). (C) Volcano plot showing differential transcription of piRNA precursors between NSDds46 and wild type. Shown in blue are 2,319 piRNA precursors being up-regulated by log2 fold change >2 (P < 0.05). (D) Volcano plot showing differential transcription of piRNA precursors between ash122/ash19011 and wild type. Shown in blue are 680 piRNA precursors being up-regulated by log2 fold change >2 (P < 0.05). (E) Bar chart showing the average number of reads mapping to precursor piRNAs originating from annotated piRNA clusters for different H3K36 methylation mutant conditions. n(H3K36R) = 24.44, n(Set2) = 14.54, n(NSD) = 9.47, n(ash1) = 6.38, n(WT) = 5.06. (F) Bar chart showing average number of reads mapping to dual-strand piRNA clusters 42AB and 38C (left) and uni-strand clusters 20A and flamenco (right). The cluster average read number per piRNA precursor in ∆HisC; 12xH3K36R (blue), Set21 (red), NSDds46 (green), ash122/ash19011 (purple), and wild type (teal), respectively: 38.51, 21.16, 12.93, 6.53, and 3.03 for cluster 42AB; 22.96, 18.38, 8.55, 4.85, and 3.25 for cluster 38C; 10.37, 7.72, 7.45, 8.45, and 6.06 for cluster 20A; 15.09, 9.32, 9.43, 10.56, and 4.88 for the flamenco cluster. Error bars in (E, F) represent 95% confidence interval.

