
FIG. 3.
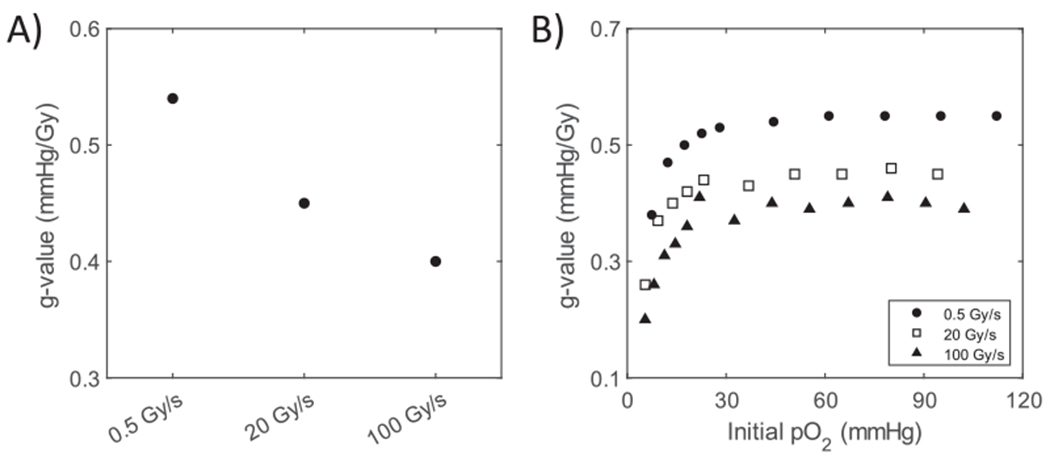
Dose rate and oxygen partial pressure effects in solutions of “CELL”. Panel A: Plot of the dose rate dependence of the ROD g-value for a 30 Gy exposure at 3 dose rates displaying a slow decrease from 0.5 Gy/s to 100 Gy/s. Panel B: Effect of initial pO2 demonstrating the decrease in ROD g-value below about 20 mmHg.