
FIG. 5.
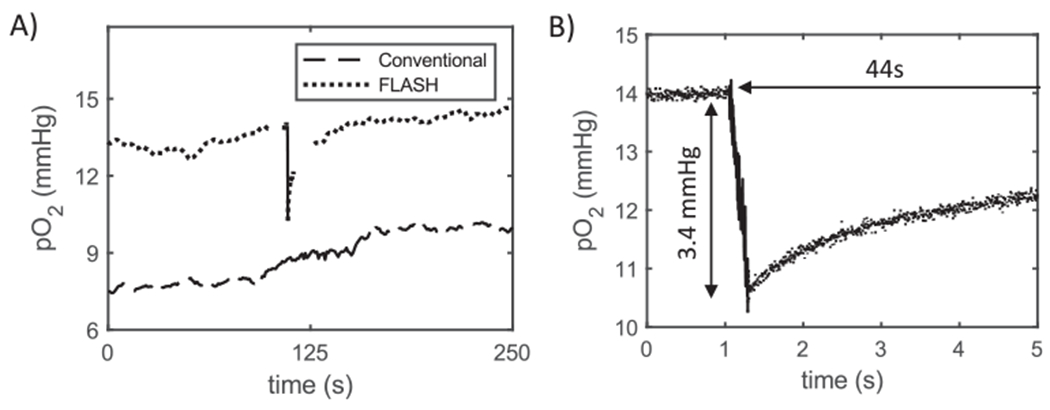
Examples of ROD in murine sarcoma tumor tissue. Panel A: Plot of partial pressure of oxygen in sarcoma tumor during the delivery of a 30 Gy dose at both conventional (lower curve, dashes) and FLASH (upper curve, dots) dose rates. The period during which radiation was delivered is shown by the solid portion of each curve, roughly at the central portion of total time. Panel B: Magnified temporal view (measurements recoded at 3 kHz) of the ROD due to FLASH irradiation and the subsequent recovery, for the pulse shown in panel A. Depletion values and recovery times displayed on graph. Note that recovery time extends well beyond the length of the ultrafast measurement window (5 s).