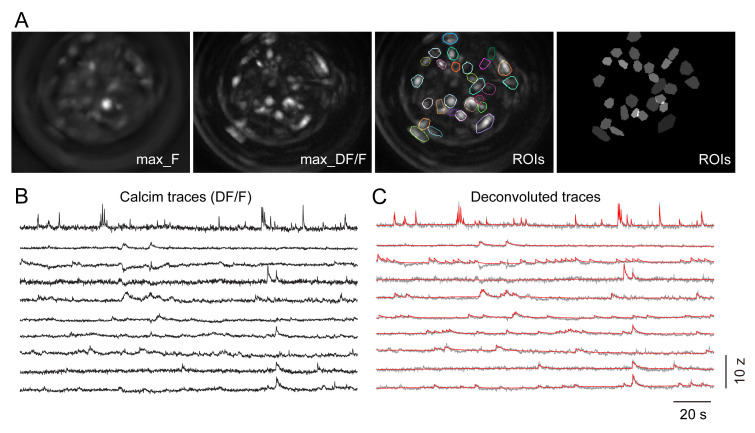
Figure 10. Calcium data processing.
A. ROI segmentation in a recording session. Images from left to right: maximum intensity of pixels across the image session, maximum projection of fluorescent changes indicated by DF/F, DF/F image superimposed with ROI labels. Segmented ROIs for each cell. B. Calcium traces presented with Z-scored DF/F after motion-correlation. C. Deconvoluted calcium traces (red) with the OASIS algorithm.

