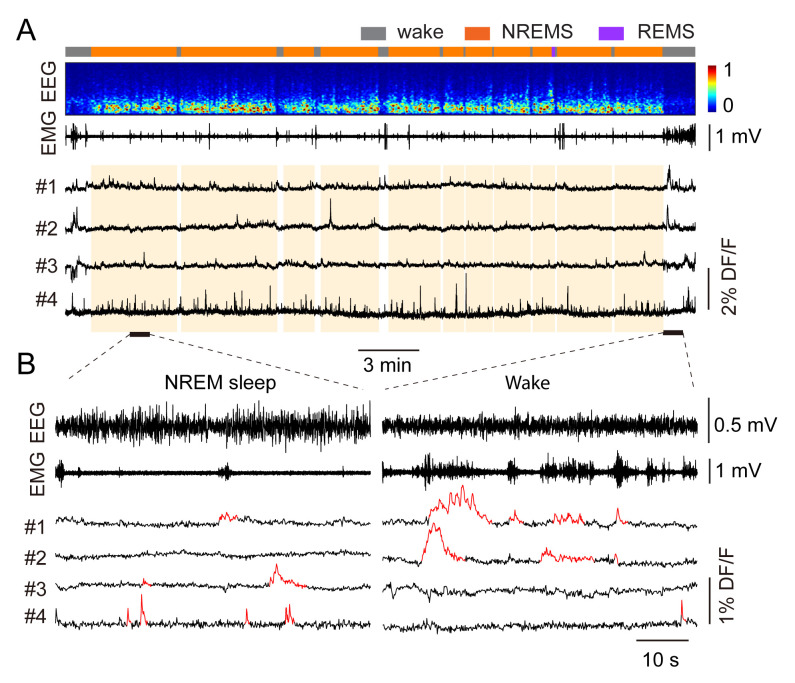
Figure 12. Identify sleep-related neuronal activity in the ventrolateral medulla (VLM).
A. Align calcium traces with EEG data. From top to bottom: brain states (gray: wake; orange: NREM sleep; purple: REM sleep), EEG spectrogram (0–25 Hz), EMG amplitude, representative calcium traces. B. Enlarged time windows showing EEG, EMG, and calcium signals in a NREM sleep period (left) and a wake period (right). Calcium events detected by the deconvoluted algorithm are highlighted in red.

