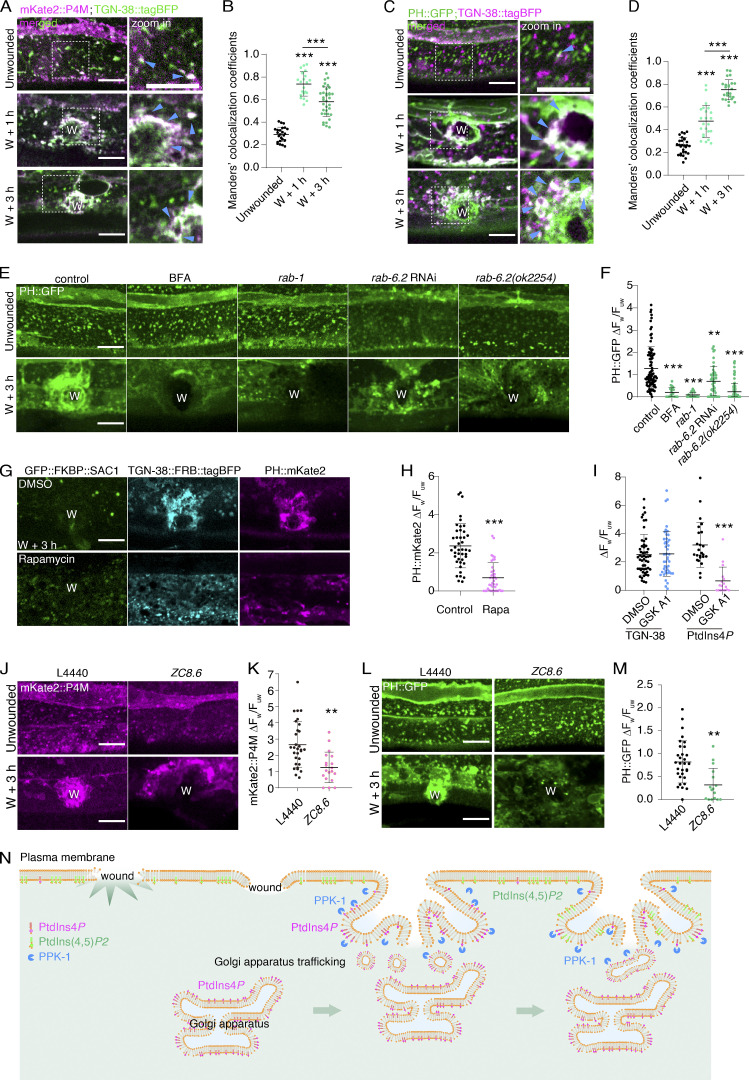
Figure 5.
The Golgi membrane enrichment provides PtdIns4P for PtdIns(4,5)P2 local generation in membrane repair. (A) Representative single-plane confocal images of mKate2::P4M and TGN-38::tagBFP before and after wounding. Pcol-19-mKate2::P4M(zjuSi333); Pcol-19-TGN-38::tagBFP(zjuSi280) transgenic animals were used for wounding and imaging. “W” indicates the wound site. The white dotted box indicates the zoom-in region. Magenta arrows point to the colocalized puncta. Scale bar: 10 µm. (B) Mander's colocalization analysis of mKate2::P4M and TGN-38::tagBFP before and after wounding. The error bars represent the mean value ± SD (n = 24, 22, 60 from the left to the right), Mann—Whitney test, ***P < 0.001. (C) Representative single-plane confocal images showing the recruitment of PH::GFP and TGN-38::tagBFP before and after wounding. Pcol-19-PH::GFP(zjuSi175); Pcol-19-TGN-38::tagBFP(zjuSi280) transgenic animals were used for wounding and imaging. The white dotted box indicates the zoom-in region. Magenta arrows indicate the colocalized puncta. Scale bar: 10 µm. (D) Mander’s colocalization analysis of PH::GFP and TGN-38::tagBFP before and after wounding. The error bars represent the mean value ± SD (n = 28, 23, 24 from the left to the right), Mann—Whitney test, ***P < 0.001. (E) Representative confocal images showing PH::GFP before and after wounding with the treatments of BFA (150 µg/ml), rab-1 RNAi, and rab-6.2 RNAi, as well as rab-6.2(ok2254) mutant. Pcol-19-PH::GFP(zjuSi175) for drug treatments and Pcol-19-PH::GFP(zjuSi175);Pcol-19-RDE-1(juIs346); rde-1(ne219) for RNAi treatment. Scale bar: 10 µm. (F) Quantitation analysis of the intensity ratio (ΔFw/Fuw) of PH::GFP in BFA (150 µg/ml) and rab-1, rab-6.2 RNAi, and rab-6.2(ok2254) mutant animals after wounding (E). The error bars represent the mean value ± SD (n = 91, 19, 24, 44, 93 from the left to the right). One-way ANOVA multiple comparisons, ***P < 0.001. **P < 0.01. (G) Representative confocal images of TGN-38:: FRB::tagBFP and PH::mKate2 accumulation at 3 h after wounding after rapamycin (100 µM) treatment. Pcol-19-PH::mKate2(zjuSi321) II; Pcol-19-TGN-38::FRB::tagBFP; Pcol-19-GFP::FKBP::SAC1(zjuEx2307) animals were used for wounding and imaging. Scale bar: 10 µm. (H) Quantitation analysis of the intensity ratio (ΔFw/Fuw) of PH::mKate2 in rapamycin and DMSO-treated worms (G). The error bars represent the mean value ± SD (n = 13 and 16). Mann–Whitney test, ***P < 0.001. (I) Quantitation analysis of the intensity ratio (ΔFw/Fuw) of TGN-38::tagBFP and mKate2::P4M with GSK-A1 (100 μM) treatment. The error bar represents the mean value ± SD (n = 54, 47, 24, 17 from the left to the right). Mann—Whitney test, ***P < 0.001. (J) Representative confocal images of mKate2::P4M before and after wounding with the treatment of zc8.6 RNAi. Pcol-19-mKate2::P4M(zjuSi333); Pcol-19-RDE-1(juIs346); rde-1(ne219) animal was used for wounding and imaging. Scale bar: 10 µm. (K) Quantitation analysis of the intensity ratio (ΔFw/Fuw) of mKate2::P4M. The error bar represents the mean value ± SD (n = 30 and 19), Mann–Whitney test, **P < 0.01. (L) Representative confocal images of PH::GFP before and after wounding with the treatment of zc8.6 RNAi. Pcol-19-PH::GFP(zjuSi175); Pcol-19-RDE-1(juIs346); rde-1(ne219) animal was used for wounding and imaging. Scale bar: 10 µm. (M) Quantitation analysis of the intensity ratio (ΔFw/Fuw) of PH::GFP. The error bar represents the mean value ± SD (n = 31 and 15), Mann–Whitney test, **P < 0.01. (N) Illustration of the proposed model on how the Golgi apparatus-originated translocation to the wound site to deliver PtdIns4P for PtdIns(4,5)P2 generation in C. elegans epidermal membrane repair. See also Fig. S3 and Video 10.

