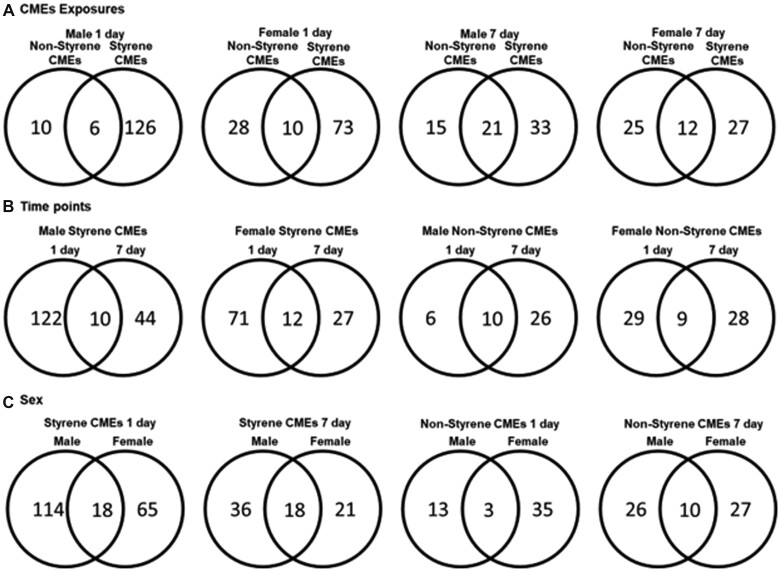
Figure 3.
Venn diagrams of numbers of unique and shared metabolites with significance found in different comparisons based on (A) exposure (styrene-CMEs and nonstyrene-CMEs), (B) time point (1- and 7-day postexposure), and (C) sex (Male and Female) from untargeted metabolite profiling assessment of serum (p < .05). All metabolites used to generate Venn diagrams (A, B, C) can be found in Supplementary Table 1.

