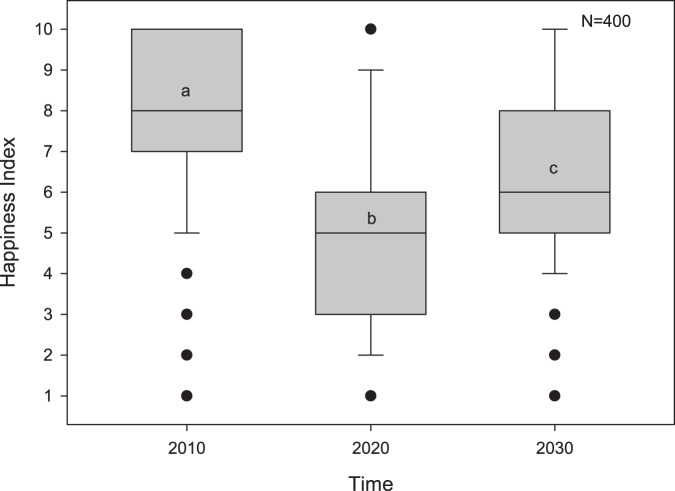
Fig. 4. Boxplots of perceived happiness index between the three time periods in the context of the COVID-19 pandemic.
Time treatments with dissimilar letters were significantly different according to Dunn’s post-hoc test after the Freidman test. The centerline of the box is the median. The bottom and top of the box are the 25th and 75th percentiles, and the whiskers below and above the box are the 10th and 90th percentiles. Points outside the whiskers are outliers.

