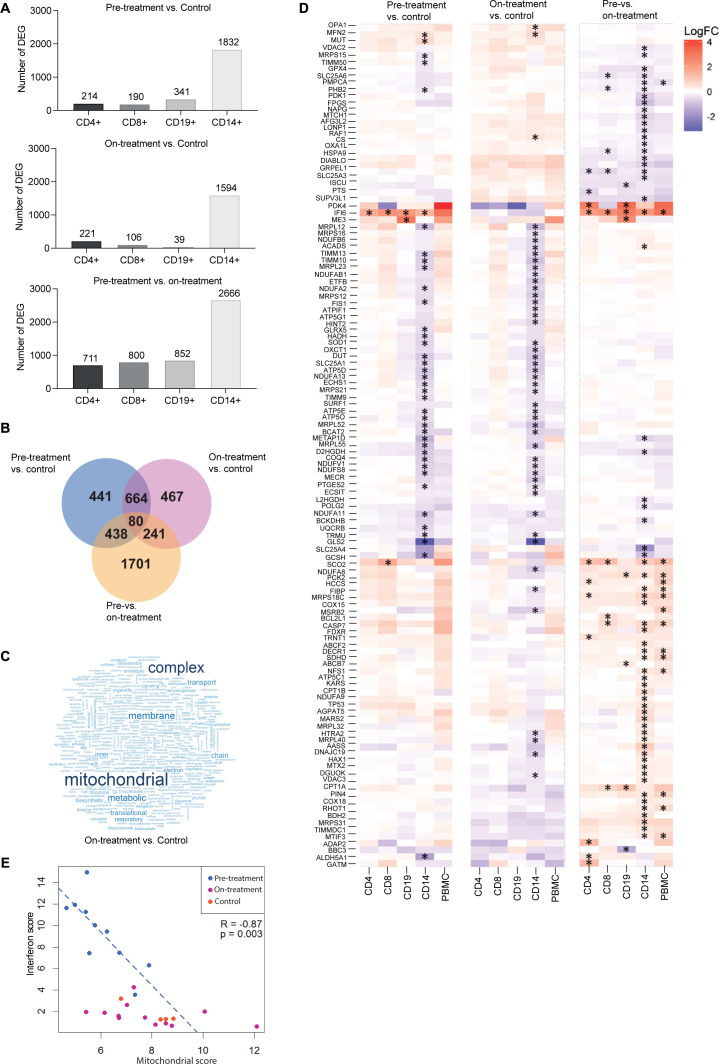
Figure 1.
A dysregulated mitochondrial gene signature characterises CD14+ monocytes from JDM patients. Transcriptomic analysis of CD4+, CD8+, CD19+ and CD14+ cells from JDM patients taken pretreatment (n=10) and ~12 months on-treatment (n=11), and age-matched healthy controls (controls, n=4). (A) Numbers of differentially expressed genes (DEG) within each cell type between JDM pretreatment versus control, on-treatment versus control and pretreatment versus on-treatment. (B) Venn diagram showing the overlap of significantly DEG from CD14+ monocytes between JDM pretreatment versus control, on-treatment versus control and pretreatment versus on-treatment. (C) Word cloud representation of gene ontology analysis of CD14+ monocytes in JDM patients on-treatment compared with controls. (D) Heatmap representing overexpression and underexpression of genes within the ‘mitochondrion’ gene ontology (GO) term. Asterisk indicate significant differential expression. (E) Negative correlation of IFN type 1 score (15 known IFN type 1—stimulated genes) with all 13 mitochondrially encoded genes (protein coding); analysis in JDM patients pretreatment and on-treatment compared with controls. IFN scores against mitochondrial scores are displayed for all samples, but Spearman correlation coefficient and p value shown are for pretreatment JDM samples. JDM, juvenile dermatomyositis.

