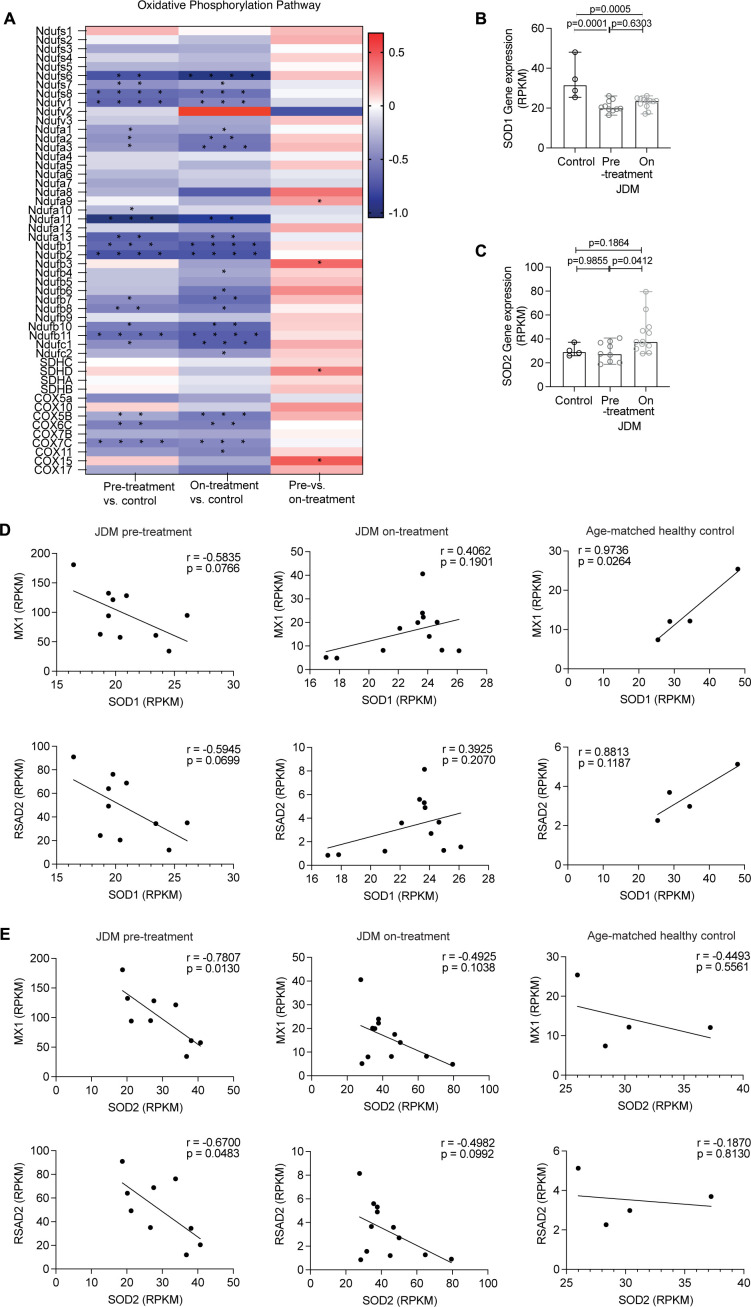
Figure 3.
Transcriptional data reveal changes to oxidative phosphorylation and superoxide regulation in JDM CD14+monocytes. (A) Heatmap showing fold change (FC) of differentially expressed genes (DEG) from KEGG oxidative phosphorylation pathway in CD14+ monocytes from JDM patients taken pretreatment (n=10) and ~12 months on-treatment (n=11), and controls (n=4). Red is upregulated (positive Fc) and blue is downregulated (negative Fc), stars represent adjusted p values (*p<0.05, **p<0.01, ***p<0.001, ****p<0.0001). Gene expression analysis of CD14+ monocytes from JDM patients taken pretreatment (n=10) and ~12 months on-treatment (n=11), and age-matched healthy (controls (n=4)). Reads per kilobase pair of transcript (RPKM) gene expression of (B) SOD1 and (C) SOD2. Correlation plots of RPKM gene expression of SOD1 (D) and SOD2 (E), to MX1 and RSAD2 (top to bottom) in CD14+ monocytes from JDM patients taken pretreatment (n=10) (left) and 12 months on-treatment (n=11) (middle) and controls (n=4) (right). All bar graphs: median with range shown. Statistical analysis: (B, C) Non-parametric Kruskal-Wallis test with Dunn’s multiple comparisons, adjusted p values. (D–E) R and p values calculated by Pearson correlation. JDM, juvenile dermatomyositis.

