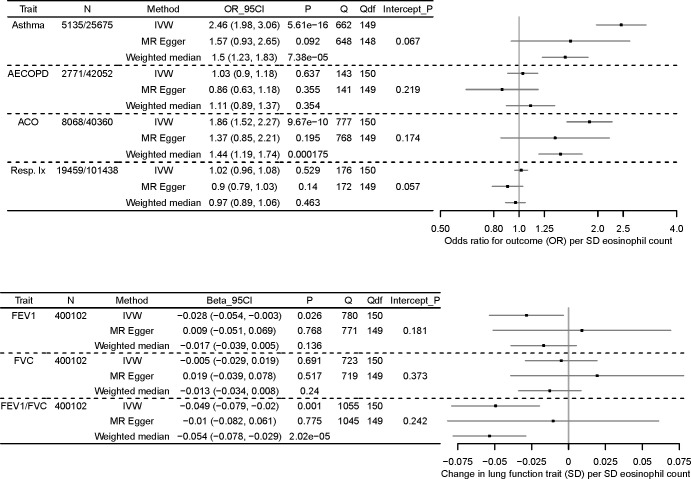
Figure 3.
MR analyses of eosinophils (exposure) on three quantitative lung function traits (top) and four respiratory disease phenotypes (bottom), using 151 eosinophil-associated SNPs top: results of MR analyses of eosinophil counts (exposure) on three quantitative lung function traits (outcome), FEV1, FVC and FEV1/FVC. A forest plot of three estimates for each traits is shown (IVW, MR Egger, weighted median), along with the maximum sample size in the outcome GWAS (N), the effect size in SD change in outcome trait per SD increase eosinophil count, and 95% CI, values for Cochran’s Q statistic (Q) and the associated df (Q_df), and the p value for the MR Egger intercept (Intercept_P). Boxes of the forest plot represent effect sizes, whiskers are 95% CIs. Bottom: results of MR analyses of eosinophil counts (exposure) on four respiratory disease phenotypes (outcome), moderate-to-severe asthma, acute exacerbations of COPD (AECOPD), asthma-COPD overlap (ACO), and respiratory infection (Resp. IX). A forest plot of three estimates for each traits is shown (IVW, MR Egger, weighted median), along with sample size in the outcome GWAS for cases and controls, respectively (N), the effect size as OR per SD eosinophil count, and 95% CI, values for Cochran’s Q statistic (Q) and the associated df (Q_df), and the p value for the Mr Egger intercept (Intercept_P). Boxes of the forest plot represent ORs, whiskers are 95% CIs. Nb only 150/151 of the eosinophil SNPs were available in the moderate-to-severe asthma GWAS. COPD, chronic obstructive pulmonary disease; FEV1, forced expiratory volume in 1 s, FVC, forced vital capacity; GWAS, genome-wide association study; IVW, inverse-variance weighted; MR, Mendelian randomisation; SNPs, single-nucleotide polymorphisms.

