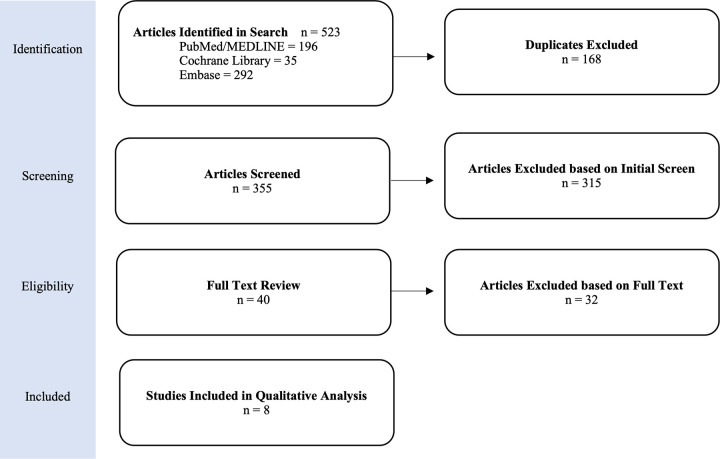
Figure 1.
Preferred Reporting Items for Systematic Reviews and Meta-Analyses (PRISMA) flow diagram. Diagram illustrates the process of identifying, evaluating, and excluding or including publications identified in the literature according to the PRISMA guidelines. This flow chart describes the number of initial publications identified from each database and how many were excluded at each screening step until only articles meeting inclusion criteria remained (8 publications total).

