
Figure 4.
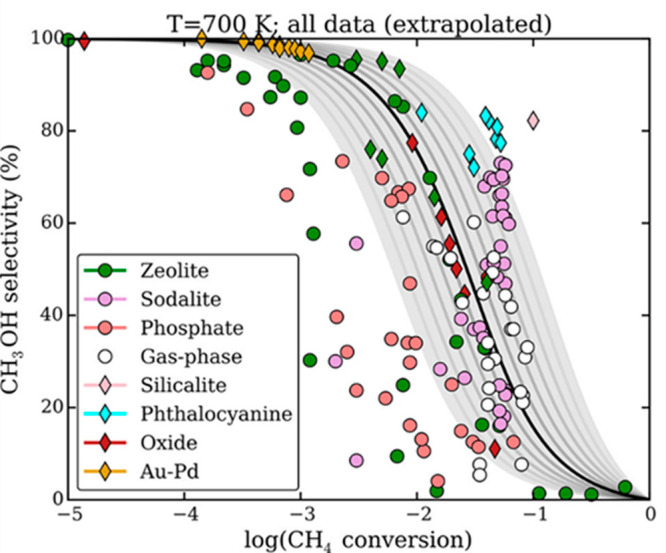
Experimental selectivities and conversions of single-site catalysts for methane oxidation to methanol. The image shows data whose selectivities have been extrapolated to the gas phase at 700 K, based on the relative rate constants for CH4 → CH3OH and CH3OH → CO2 derived from the difference between the free energies of activation for methane and methanol. Colors denote different catalyst morphologies, diamonds are aqueous experimental reaction conditions, and circles are gas phase. Reproduced with permission from ref (70). Copyright 2018 American Chemical Society.