

Summary
Transcription factors of the Myc proto-oncogene family promote cell division, but how they do this is poorly understood. Here we address the functions of Drosophila Myc (dMyc) during development. Using mosaic analysis in the fly wing, we show that loss of dMyc retards cellular growth (accumulation of cell mass) and reduces cell size, whereas dMyc overproduction increases growth rates and cell size. dMyc-induced growth promotes G1/S progression but fails to accelerate cell division because G2/M progression is independently controlled by Cdc25/String. We also show that the secreted signal Wingless patterns growth in the wing primordium by modulating dMyc expression. Our results indicate that dMyc links patterning signals to cell division by regulating primary targets involved in cellular growth and metabolism.
Introduction
Normal development requires coordinate regulation of cell growth, cell cycle progression, apoptosis, and terminal differentiation (Conlon and Raff, 1999). Many developmental abnormalities and cancers are thought to arise from regulatory defects in the genes controlling these processes (Raff, 1996). One notable group of such genes is the myc family of proto-oncogenes. myc family genes are frequently rearranged and deregulated in a wide range of tumors in many animal species, and their normal functions appear to be closely tied to cell division, differentiation, and apoptosis (Henriksson and Luscher, 1996). How Myc actually contributes to control of these processes is not understood.
The cellular functions of Myc have been analyzed in tissue culture cells, and the evidence points to a role in cell cycle progression. For example, Myc protein and mRNA are normally absent in quiescent and differentiating cells but are rapidly induced upon exposure to growth factors (Kelly et al., 1983; Armelin et al., 1984; Henriksson and Luscher, 1996). Forced expression of Myc in some but not all types of quiescent cells can drive entry into S phase (Eilers et al., 1991; Leone et al., 1997). Overexpression of Myc in cycling cells can accelerate cell division, reduce requirements for growth factors, and prevent cell cycle exit (Sorrentino et al., 1986; Stern et al., 1986; Karn et al., 1989). Conversely, elimination of myc mRNA arrests cycling cells in G1 (Heikkila et al., 1987), and a failure of myc induction in response to mitogenic signaling blocks resting cells from entering the cycle (Roussel et al., 1991).
The correlation between Myc expression and cell division is not absolute, however, as myc mRNA is present in some nondividing cell types in vivo and in vitro (Downs et al., 1989; Craig et al., 1993; Wakamatsu et al., 1993). Furthermore, the absolute requirement for Myc activity in dividing cells has been questioned by targeted deletion studies. First, while embryonic mice with knockouts of c-myc or N-myc die during midembryogenesis, their cells divide extensively beforehand (Davis et al., 1993; Stanton et al., 1993). Second, a cell line with somatic disruption of the c-myc gene is capable of cell division in the absence of both N-myc and L-myc expression, albeit at a greatly reduced rate (Mateyak et al., 1997). These observations suggest that myc is not an obligate component of the cell cycle control apparatus.
All Myc proteins contain a basic-helix-loop-helix-zip-per (bHLHZ) dimerization and DNA-binding domain. This region permits heterodimerization of Myc family proteins with the cognate domain of the small bHLHZ protein Max. Myc-Max heterodimers bind E box DNA sequences of the CACGTG class and activate transcription at promoters containing proximal binding sites (Blackwood et al., 1992; Amati and Land, 1994; Henriksson and Luscher, 1996). Myc is also known to repress transcription, although the mechanism has not been defined (Li et al., 1994). Although 33 putative Myc target genes have been identified, this has not clarified Myc’s function (Zornig and Evan, 1996; Grandori and Eisenman, 1997; Dang, 1999). For example, Cdc25A is the only cell cycle regulator known to be a direct target of Myc (Galaktionov et al., 1996), but activation of this gene alone does not explain Myc’s effect on the cell cycle (Amati, 1998). Many proposed Myc targets have no obvious link to cell cycle control. Therefore, Myc is likely to regulate cellular activities other than, or in addition to, the cell cycle machinery.
Previously, the hypomorphic female sterile mutation diminutive1 of Drosophila melanogaster was identified as an allele of myc (Gallant et al., 1996; Schreiber-Agus et al., 1997). Drosophila Myc protein (dMyc) specifically associates with Drosophila Max (dMax), and dMyc-dMax heterodimers bind E box sequences and stimulate transcription, suggesting that these proteins share common functions with vertebrate Myc (Gallant et al., 1996). Here we describe two additional, more severe dmyc alleles and characterize their defects at the organismal and cellular levels. We show that mutations in dmyc lead to a decrease in cell size, body size, and viability. We also describe experiments in which overexpressed dmyc accelerates cellular growth in the developing wing. Our experiments provide direct evidence that dmyc functions in vivo to control cellular growth (defined as an increase in cellular mass) as part of a network that regulates animal size.
Results
Isolation of Novel dmyc Mutants
To obtain alleles of dmyc stronger than diminutive1 (hereafter called dmycdm1), we searched the published mutations within the genomic region harboring dmyc for P element insertions. We identified a P element inserted immediately upstream of the putative transcription start site of dmyc (Figure 1). This allele, dmycP0, had similar but additional defects in comparison to dmycdm1 (Table 1). We mobilized the P element in dmycP0 and recovered another mutant, dmycP1, which showed even more severe defects (Table 1). Three lines of evidence indicated that the P element in dmycP0 and dmycP1 caused the dmyc mutant phenotypes. First, the most readily scored phenotype (thin bristles) was tightly linked genetically to the P element, as deficiency mapping placed both between 3C11 and 3D6 (Table 1). Second, both P alleles have dramatically reduced levels of dmyc mRNA in imaginal discs (Figure 7B). Third, most of the defects were rescued by expression of dmyc cDNA (Table 1).
Figure 1.

Molecular and Genetic Characterization of dmyc Mutants
(A) Map of genomic sequences surrounding the dmyc locus, located at 3D5 on the X chromosome. The dmycP0/P1 P element is inserted within less than 100 bp upstream of the putative transcription start site. Also shown is the insertion site, within the first intron of dmyc, of the gypsy element giving rise to the dmycdm1.
(B) Adult male wild-type (left) and dmycP0 mutant (right) flies, illustrating their size difference.
(C) Scanning electron micrographs of the dorsal thorax of wild-type (left) and dmycP0 mutant (right) males. Note the shortened and more slender bristles of the mutant compared to the wild type.
Table 1.
Phenotypes and Rescue of dmyc Mutants
| Genotype | Viability (%) (n) | Bristle Area, Pixels (n) | Cell Area (μm2) | Wing Width (μm) | Wing Length (μm) |
|---|---|---|---|---|---|
| WT | 85 (214) | 1994 (25) | 173 | 930 ± 20 | 1827 ± 40 |
| dmycdm1/Y | 99 (221) | nd | nd | nd | nd |
| Dmyc P0 /Y | 83 (197) | 1497 (36) | 150d | 865 ± 40d | 1685 ± 40d |
| dmycP1/Y | 29 (81) | 768 (18) | 149d | 820 ± 40d | 1587 ± 60d |
| dmycP0/Y + dMyc | nd | 1881 (38)b | 182c | 896 ± 35c,d | 1805 ± 13c |
| dmycP1/Y + dMyc | 77 (186)a | 1155 (21)b | nd | nd | nd |
| Complementation | ||||
|---|---|---|---|---|
| Genotype | Viability (%) | Bristles | (n) | Breakpoints |
| dmycP0/WT | 88 | + | (198) | - |
| dmycP0/Df(1)N8 | 0 | − | (137) | 3C1;3D6 |
| dmycP0/Df(1)75e19 | 45 | − | (151) | 3C11:3E4;5E |
| dmycP0/Df(1) GA102 | 100 | −/+ | (200) | 3D5;3F7–8 |
| dmycP0/Df(1) HC244 | 100 | + | (82) | 3E8;4F11 |
Viability is expressed as a percentage of the expected number. Wings from dmyc mutant adults were examined for trichome density to determine cell size (area). The number of trichomes from a specific region next to the posterior crossvein was counted within a 0.05 mm square and converted to area/cell (μM2). There were 43 squares from dmycP0 male wings, 31 each from dymcP1 and control male wings, and 34 from dymcP0; C765>dMyc male wings. Wing width is the distance from the posterior margin (at vein 5) perpendicular to the anterior margin. For wing length, vein 3 was measured from its origin in the hinge to the distal wing tip. A total of 20 dmycP0, 20 dmycP1, 26 dmycP0; C765>dMyc, and 15 control male wings were analyzed. Rescue of specific dmyc phenotypes by overexpression of dMyc cDNA was carried out by three means (see footnotes a–c). Complementation tests of dmycP0 with X chromosome deficiencies were carried out by crossing dmycP0 animals to wild-type (WT) flies or to flies carrying the deficiencies noted, and dymcP0/Df progeny were scored for viability. dymc is located at 3D5. (n), number of animals scored; nd, not determined.
Heat shock–induced (HS) dMyc transgene was used.
Scabrous Gal4 and UAS-dMyc used.
C765-Gal4 and UAS-dMyc used.
p ≤ .001 (reference = WT).
Figure 7.

dmyc Expression in the Wing Disc and Its Effect on the Cell Cycle
(A) In situ hybridization of a wing disc to dmyc mRNA. dmyc mRNA is present at high levels in the wing pouch and at lower, variable levels throughout the rest of the disc but is not expressed in cells flanking the dorsoventral (D/V) boundary of the disc (arrow). These cells make up the zone of nonproliferating cells (ZNC). In these images, anterior is to the left and dorsal is up.
(B) In situ hybridization of dmycP1 mutant wing disc, showing that dmyc mRNA is undetectable in all regions of the disc. A similar result was observed for dmycP0.
(C) The absence of dmyc mRNA in the ZNC requires the activity of Wingless. Wing disc in which a dominant-negative form of TCF (dnTCF) is expressed specifically in the ZNC under control of C96>Gal4. dnTCF blocks Wingless activity in the ZNC and results in the induction of dmyc mRNA (arrow).
(D) Control wing disc labeled with the S phase marker BrdU, showing the ZNC as a population of arrested cells surrounding the D/V boundary (bracket).
(E) BrdU-labeled wing disc in which dMyc is expressed specifically in the ZNC with C96>Gal4. Many of the cells at the D/V boundary have incorporated BrdU, indicating they are not arrested (bracket). The cell cycle arrest of the ZNC includes a G2 arrest in anterior cells flanking the D/V boundary and a G1 arrest in the anterior cells at the D/V border and in all posterior cells (see Johnston and Edgar, 1998). Interestingly, ectopic expression of dMyc prevents only the G1 arrest. Inset shows pattern of C96>Gal4 with expression of GFP.
(F) Model for regulation of cellular growth and cell division by dMyc in wing disc cells. Extracellular signaling molecules such as those regulating metabolism (e.g., insulin) or patterning (e.g., Wingless) signal to dMyc to regulate cellular growth. Cyclin E activity is modulated in response to the altered growth rates and controls the G1/S transition. Although our data suggest that dMyc controls Cyclin E posttranscriptionally, we cannot rule out a more direct influence (broken arrow). However, indirect regulation of Cyclin E activity by Myc has been documented in vertebrate cells (Amati, 1998). The length of the cell cycle is also limited by the availability of Stg/Cdc25. Stg/Cdc25 expression is independently controlled by the patterning signals (e.g., Johnston and Edgar, 1998); thus, cell cycle rates can be controlled at both G1/S (by cellular growth) and G2/M (by Stg/Cdc25).
dmyc Mutations Cause Size Defects in the Adult
Both dmycP0 and dmycP1 mutations cause a variety of phenotypic defects. Like dmycdm1, dmycP0 and dmycP1 homozygous females are sterile, and both male and female adults are significantly smaller than wild type and have thinner, shorter bristles (Gallant et al., 1996; Schreiber-Agus et al., 1997) (Figures 1B and 1C). In contrast to dmycdm1 mutants, dmycP0 and dmycP1 mutants develop more slowly than wild type and occasionally have rough, small eyes (not shown). In addition, dmycP1 mutants are subviable (Table 1). These phenotypes suggest an allelic series that can be ordered from the weakest to strongest, where dmycdm1 < dmycP0 < dmycP1. Two observations suggest that dmycP0 and dmycP1 are hypomorphic, rather than complete loss-of-function alleles. First, although dmyc mRNA expression was severely reduced in mutant imaginal discs (Figure 7B), full-length dmyc transcripts were detected in adult dmycP0 and dmycP1 homozygous females by Northern blot (not shown). Second, the viability of dmycP0 and dmycP1 de creased dramatically when they were in trans to deficiencies that removed the dmyc locus (Table 1), a standard test for hypomorphic function (Ashburner, 1989).
Interestingly, although dmyc mutant adults are small and take longer to develop, their body parts are appropriately proportioned, with no patterning or cell fate specification defects other than the variably penetrant eye phenotype. The dmyc mutants phenocopy mutations in biosynthetic pathways that directly influence cellular growth (e.g., Minutes, Dopa decarboxylase, SAM decarboxylase), as well as mutations in the insulin receptor pathway (e.g., chico; Böhni et al., 1999), which regulates metabolism. Therefore, we tested whether the dmyc phenotypes reflect cellular growth defects.
dmyc Cells Are Smaller than Wild-Type Cells
In general, small body size in Drosophila results from a reduction of both cell size and cell number (Stern and Emlen, 1999). To determine the relative contributions of these parameters to the smaller body size of dmyc mutants, we measured the size of dmyc cells at two distinct stages of development: in adult wings and in their precursors in the wing imaginal disc. We dissociated wing discs from mature control and dmyc mutant larvae, stained the cells with a DNA dye, and examined them by flow cytometry, where the relative cell size of a population of cells can be obtained from the forward scatter (FSC) distribution (Neufeld et al., 1998). By the FSC assay, dmyc cells were substantially smaller than wild type. FSC values of dmycP0 cells were reduced by 17% and those of dmycP1 by 23% compared to wild type (Figure 2A).
Figure 2.

Analysis of Cell Size in dmyc Mutant Wing Discs
(A) Representative forward scatter (FSC) distributions of control (green), dmycP0 (red), and dmycP1 (blue) wing disc cells from flow cytometric analysis. Three independent experiments were performed with similar results. The mean FSC height of each genotype (and FSC values for cell cycle phases) is, control, 117 (G1 = 105.9, S = 116.7, G2 = 129.3); dmycP0, 97 (G1 = 81.8, S = 91.3, G2 = 105.3); and dmycP1, 79 (G1 = 67, S = 72, G2 = 91).
(B) DNA profiles from the flow cytometric analysis in (A). The traces for each genotype are color coded as in (A).
The DNA profiles of cells from dmyc mutants were nearly identical to controls but did show a small yet reproducible increase in the G1 fraction relative to control cells of the same developmental age (Figure 2B and not shown). Since cells in G1 are smaller than S phase or G2 cells, we determined FSC values for the G1, S, and G2 fractions separately. These measurements established that dmyc mutant cells are smaller in each phase of the cell cycle (Figure 2).
To determine whether the dmyc mutant cells remained small throughout development, we examined cell size in adult wings. Each epidermal cell of a wing secretes a single hair, called a trichome. Trichome density is indicative of cell size in the wing. We scored the number of trichomes within a precisely defined area of the wing blade from wild-type and dmyc adult males and found more cells per unit area in dmycP0 and dmycP1 mutant wings than in control wings. The cell area in both mutants was approximately 14% smaller than wild-type cells (Table 1). Furthermore, measurement of the length and width of mutant and wild-type wings showed that wings from dmycP0 and dmycP1 males are between 8% and 15% smaller in each dimension than controls (Table 1). Thus, the small dmycP0 wing size is due to smaller cells. Calculation of an approximate area (length × width) of the mutant wings suggests that dmycP1 wings may also have fewer cells. Expression of a UAS-dMyc transgene under control of a Gal4 driver that is expressed ubiquitously in the wing disc completely rescued the cell size reduction in dmycP0 wings and also rescued the length (99%) and width (96%) of their wings (Table 1). These data demonstrate that the cell size defects in dmyc wings are dmyc specific. The reduced size of dmyc mutant wing disc cells and the adult wing cells indicates that dmyc is required for normal cell size. Since wing size is strictly proportional to body size (McCabe et al., 1997), we also conclude that dmyc is required for the normal body size of the adult fly (Figure 1B).
dmyc Mutant Cells Grow Poorly
The small size of dmyc mutant cells suggested that they may be compromised for growth. In the Drosophila wing, cells with growth defects are subject to cell competition, a phenomenon in which slowly growing cells are eliminated when surrounded by normal cells. Cell competition was first described in Minutes, a class of mutations with a combination of phenotypes remarkably similar to those of dmyc, including developmental delay, thin bristles, and small body size (Morata and Ripoll, 1975; Simpson and Morata, 1981). All molecularly characterized Minute genes encode ribosomal proteins; thus, the Minute phenotypes are thought to arise from impaired protein synthesis (Lambertsson, 1998). We tested dmyc mutant cells in a cell competition assay by using mitotic recombination to generate mosaic wing discs at specific times in development (Xu and Rubin, 1993). After recombination, both homozygous wild-type (+/+) clones (which we call “twins”) and homozygous mutant (−/−) clones are generated in heterozygous dmycP0 or dmycP1 animals. Since these paired clones are derived from a recombination event in a single mother cell, and are thus the same age, their relative growth reflects differences in genetic makeup. Disc epithelial cells grow as a mono-layer and after division remain associated; thus, clonal growth can be directly compared by measuring the area of −/− and +/+ sister clones. Clonal growth is the sum of accumulation of cell mass (through increase in cell size and cell number) and loss of mass through cell death. Reduced growth leads to reduced survival through cell competition (Morata and Ripoll, 1975). Therefore, we measured the growth of dmyc−/− clones and their sister (+/+) clones by quantitating the area of each clone after a defined period of time.
By this assay, both dmycP0−/− and dmycP1−/− mutant clones grew very poorly in comparison to their +/+ twins. This resulted in +/+ twins with no accompanying dmyc−/− mutant clone or dmyc−/− clones that were much smaller than their +/+ twins (Figure 3A). This effect was most striking in posterior compartment clones allowed to grow for 70 hr (Figure 3A). Posterior cells divide faster than anterior cells during disc development (García-Bellido and Merriam, 1971), and cell competition is more intense when the division rates between competing cells are more disparate (Simpson and Morata, 1981). Thus, the smaller size of posterior clones induced early in disc development probably reflects stronger competition between dmyc−/− cells and both the +/+ twins and +/− surrounding cells in the posterior compartment during this time. In support of this idea, when clones were induced later in development, dmyc−/− cells were still outcompeted, but the area occupied by anterior and posterior clones was similar (not shown). These results indicate that dmyc mutant cells have a strong growth disadvantage when in competition with nonmutant cells.
Figure 3.
Cell Competition of dmyc Mutant Cells
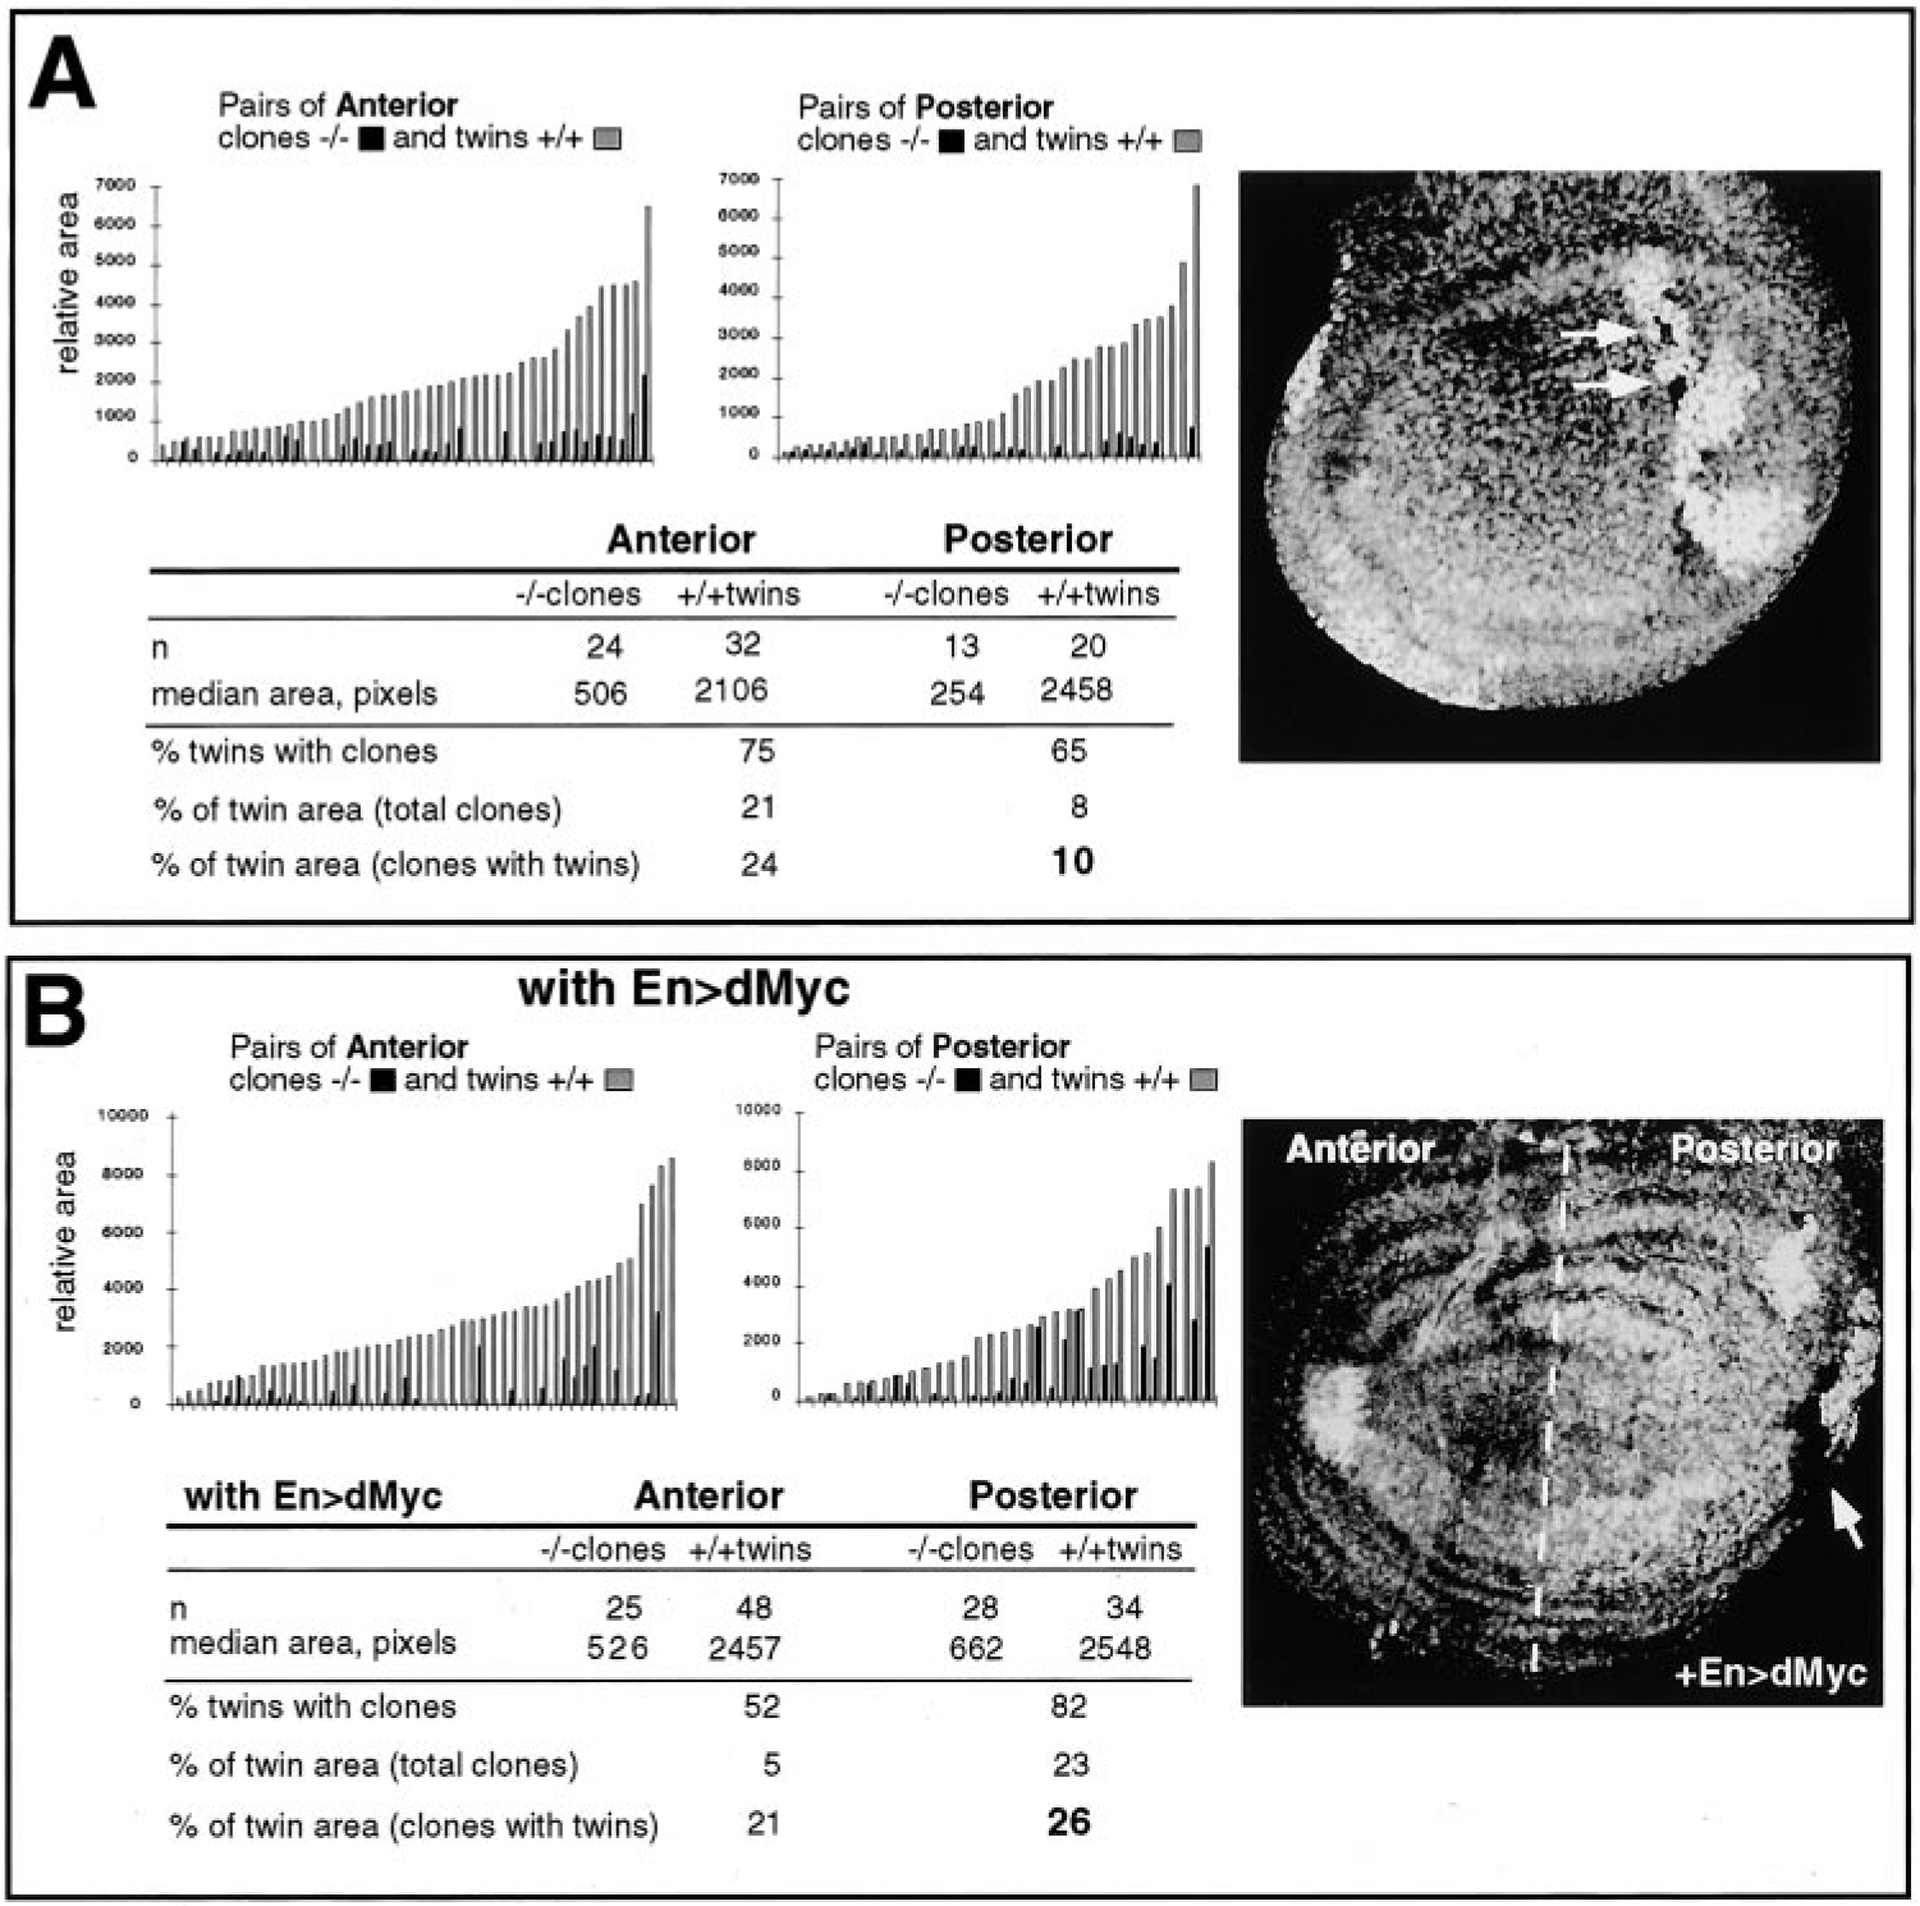
(A) Cell competition assay. Right, confocal image of a dmycP0+/− wing disc in which mitotic recombination was induced, yielding pairs of dmycP0−/− clones (black; arrows) and +/+ wild-type twins (white). Note that the mutant clones (arrows) are much smaller than their sister wild-type twins. Left, graphs showing the relative sizes (clone areas, in pixels) of individual pairs of dmycP0−/− clones (black bars) and +/+ twins (gray bars). Left, pairs of −/− clones and +/+ twins located in the anterior (A) compartment of the wing disc; right, pairs of −/− clones and +/+ twins located in the posterior (P) compartment of the wing disc. Below is a tabulation of the data, divided into anterior and posterior. Clones in the posterior of the disc grow even more poorly than in the anterior (see text). n, number of clones or twin spots. Similar results were obtained with dmycP1.
(B) Engrailed-Gal4 driving expression of UAS-dMyc (En>dMyc) in the posterior compartment of dmycP0+/− discs confers a partial rescue of the growth disadvantage of dmycP0−/− clones. Right, confocal image of dmycP0, En-Gal4>UAS-dMyc-expressing disc stained for anti-Myc antibody and showing dMyc protein in the posterior compartment. Posterior cells, to the right of the dashed line, are expressing dMyc. Left, as in (A), the graphs represent pairs of −/− clones and +/+ twins, grouped into anterior and posterior. The number of +/+ twin spots with accompanying −/− clones is increased relative to control posterior cells (B), as is the relative size (area, in pixels) of the −/− clones (compare bold number here with the bold number in [A]). A −/− clone that is rescued is indicated by the white arrow.
To demonstrate that this clonal growth defect was due to the mutations in dmyc, we rescued the defect by overexpressing UAS-dMyc using Engrailed-Gal4. En>Gal4 is constitutively expressed only in cells of the posterior half of the disc, making anterior cells a useful internal control. As shown in Figure 3B, when En>dMyc was expressed the number and average size of dmyc−/− mutant clones in the posterior was significantly larger than in the anterior, where the dMyc transgene was not expressed. Thus, ectopic expression of dMyc can confer a partial growth advantage on dmyc mutant cells and counteract the effects of cell competition.
Overexpressed dMyc Increases Cell Size
The above observations indicate that insufficient levels of dmyc impair growth. We hypothesized that overexpressing dmyc in wild-type cells might therefore drive excessive growth. To test this, we overexpressed dMyc in the wild-type wing disc in random clones of cells using Gal4 driven by the Actin5C promoter (Act>CD2>Gal4; see Experimental Procedures) (Struhl and Basler, 1993; Pignoni and Zipursky, 1997). Inducing clones with this method allowed us to control several meaningful parameters: the point during development when transgene expression is activated, the duration of expression, and the number of clones per disc expressing the transgene. Importantly, it enabled us to directly measure the effect of dMyc overexpression on growth rates as well as on cell size.
Clones of cells expressing Act>Gal4 were induced at specific times, activating coexpression of dMyc and GFP or GFP alone as a control. These clones were then examined after set intervals by fluorescence-activated cell sorting (FACS) for cell size (by FSC) and DNA content. The GFP distinguished the dMyc-expressing cells from the nonexpressing cells, and the GFP-negative cells functioned as an internal control. Within 24 hr of clone induction, dMyc-expressing cells were larger than controls, showing FSC values of 46% ± 8% greater than the control cells (Figure 4A and Table 2). dMyc-overexpressing cells were larger in each phase of the cell cycle, indicating that the cell size increase was not due to the increase in the population of G2 cells (Table 2).
Figure 4.

Overexpression of dMyc in Wild-Type Wing Discs
(A) FSC plots showing the relative size of control cells versus dMyc-expressing wing disc cells. Left panel, cells are expressing dMyc in random cell clones using Act>Gal4. dMyc-expressing cells also express GFP (green); control, GFP-negative cells are from the same disc (red). Right panel, FSC plot of En>dMyc, GFP-expressing discs. Green trace, posterior cells coexpressing GFP and dMyc; red trace, control, non-GFP-expressing anterior cells.
(B) Rhodamine-phalloidin staining of actin in a normal wing disc, showing that anterior and posterior cells are very similar in size at this stage of development. Arrow points to the boundary between anterior and posterior cells. A, anterior; P, posterior.
(C) Actin staining of a wing disc expressing dMyc in posterior cells (right part of disc) under En>Gal4 control. Inset shows magnified detail of the A/P border, showing the large, dMyc-expressing cells in the posterior. These cells have a mean FSC value 16% larger than anterior control cells (see [A]).
Table 2.
Size and Cell Cycle Measurements in Wing Discs from dMyc-Overexpressing Animals
| dMyc Overexpression in Wing Disc Cells | |||||||
|---|---|---|---|---|---|---|---|
| Genotype | FSC (Ratio) | % G1 | FSC G1 | %S | FSC S | % G2 | FSC G2 |
| Act>GFP | 1.0 | 29.3 | 1.0 | 30.2 | 1.0 | 40.5 | 1.0 |
| Act>dMyc | 1.5 | 5.3 | 1.5 | 35.0 | 1.5 | 59.7 | 1.5 |
| Act>CycE | 0.9 | 2.8 | 1.0 | 65.6 | 1.0 | 31.6 | 1.0 |
| Act>Stg | 1.0 | 41.0 | 1.0 | 32.0 | 0.9 | 27.0 | 0.9 |
| Act>dMyc, Stg | 1.1 | 19.9 | 1.1 | 65.5 | 1.1 | 14.6 | 1.2 |
Forward scatter (FSC) values and cell cycle phasing in cells overexpressing dMyc under control of Act>Gal4. FSC ratios are the mean FSC height for the appropriate transgene (which is coexpressed with GFP) to that of the internal, GFP-negative control cells. FSC ratios of cells in each phase are also given. At least three independent experiments gave similar results; the values shown here are from the analysis of one experiment.
A clear increase in cell size was also apparent in cells of the posterior compartment when we expressed dMyc with En>Gal4 (Figures 4A–4C). The increase in cell size is maintained through the rest of wing development, since trichome density in the posterior of En>dMyc adult wings was less than in the anterior (data not shown). Despite the larger cells, the posterior compartments of these wings were not significantly overgrown, indicating that the patterning mechanisms that control compartment size (e.g., apoptosis) were not altered by dMyc (data not shown). Our observations indicate that the ability of dMyc to increase cell size is independent of cellular context or developmental stage. They also suggest that although dmyc is important for normal cell and body size, the proportions of individual organs are governed by the pattern system.
dMyc Overexpression Increases Cellular Growth Rates
Although the increase in cell size after overexpression of dMyc suggested an increased rate of growth, we wished to measure growth rates directly. The area encompassed by a clone of GFP-positive, dMyc-expressing cells reflects the growth achieved over time by all of the cells within the clone (Figure 5A). As shown in Figure 5B, clones induced late in disc development, as well as those induced early, increased in area at faster rates than control clones. Staining with acridine orange showed that overexpressed dMyc induced some apoptosis (data not shown). Consequently, in some experiments we coexpressed the baculovirus caspase inhibitor P35 (Hay et al., 1994) along with dMyc. However, suppressing cell death did not detectably affect dMyc-induced growth (not shown). In addition, the thickness of the disc epithelium remained normal, indicating that the clone areas were a reasonable measure of clonal volume. We conclude that the dMyc-induced increase in cell size, leading to a larger clone area, reflects a direct increase in growth rates.
Figure 5.

Growth of Clones Overexpressing dMyc
(A) Two dMyc-expressing Act>Gal4 cell clones (right) or three control clones (left), showing that the area encompassing dMyc-expressing clones is larger than that of control clones. Clones were induced at 48 – 4 hr AED and fixed for analysis at 118 – 4 hr AED.
(B) Quantitation of the areas of control Act>Gal4 clones and clones expressing dMyc. Clones were induced at 48 or 72 hr AED and analyzed at 118 hr AED. dMyc-expressing clone areas were larger than controls at both time points. Mass doubling times (mass DT; see Experimental Procedures) for 70 hr clones (48–118 hr AED), Act>GFP control = 12 hr; Act>dMyc = 9.4 hr. Very similar mass DTs were obtained for clones induced at 72 hr and fixed at 118 hr AED. n, number of clones analyzed. The asterisk indicates p ≤ .001 relative to control.
dMyc Alters Cell Cycle Phasing but Not Cell Cycle Rates
Since c-Myc has a pronounced effect on cell cycle progression in mammalian cell culture (Amati, 1998), we asked whether dMyc affected cell cycle progression or cell division rates in wing discs. We approached this question first by expressing dMyc in actively dividing cells and then by expressing dMyc in populations of arrested cells.
To express dMyc in dividing cells of the wing disc, we used either the En>Gal4 or Act>CD2>Gal4 drivers. With each driver, dMyc caused a strong reduction in the fraction of cells in G1 and a concomitant increase in cells in S phase and G2 (Figure 6A). Whereas at this stage of development control cells spent approximately one-third of the cell cycle in each of G1, S, and G2 phases, Act>dMyc cells spent only 5% of the cell cycle in G1 but 35% of the time in S and 60% in G2 (Table 2). This cell cycle effect was independent of when we induced dMyc expression, since the same phase distribution was seen in cells exposed to dMyc for less than 24 hr or more than 4 days prior to analysis.
Figure 6.

Cell and Mass Doubling Times of Clones Overexpressing dMyc or dMyc+Stg
(A) Left, cell cycle profile from FACS analysis of cells expressing Act>dMyc and GFP (green trace) and from internal control (GFP-negative cells; red trace). dMyc expression results in a smaller fraction of G1 cells and an increase in the S and G2 fractions relative to the controls. Right, cell cycle profile of clones of cells expressing both dMyc and Stg under Act>Gal4 control. The presence of the mitotic inducer Stg prevents the reduction of G1 cells and the increase of G2 cells by dMyc.
(B) Act>dMyc, Act>Stg, or Act>dMyc+Stg cell clones were induced at 72 hr and analyzed at 120 hr AED. Left panels, cells in each clone were counted, and cell doubling times for each genotype are indicated. Clones are displayed as the distribution of clonal cell number, with the range reflecting the inherent variability of cell division rates within the wing disc. Cell doubling times (cell DT) were calculated from the median size of the clone. Although the distribution of clonal cell number is similar for control, Stg alone, and dMyc alone, the median number of cells expressing dMyc+Stg is larger, as a result of a faster cell DT. Right panels, analysis of mass doubling times (mass DT) of the cell clones represented on the left (Act>GFP and Act>dMyc clones are a subset of the clones on left). The total number of pixels within each clone (the clone area) was measured and converted to μM2, where 1 pixel = 0.782 μM2. The mass doubling time was calculated as described in the Experimental Procedures, from the median clone area. n, number of clones scored.
We calculated cell doubling times (cell DT) by counting the number of cells in Act>dMyc cell clones after defined periods of time. Surprisingly, despite the phase changes induced by dMyc, there was no change in the overall length of these cell cycles (Figure 6B). Coexpression of the cell death inhibitor P35 with dMyc in these experiments did not shorten cell doubling times or alter the phase changes (not shown). Thus, dMyc overexpression does not alter rates of cell cycle progression, and the major effect of dMyc is to increase the growth rate, leading to a greater cell mass rather than an increase in cell number.
dMyc Overexpression Promotes G1/S Progression
The abbreviated G1 phase in cells overexpressing dMyc may occur because dMyc promotes the G1 to S phase transition. Alternatively, it may be secondary to an elongation of the S and G2 phases caused by dMyc. We have previously shown that the mitotic inducer String (Cdc25) is limiting for the G2/M transition in wing disc cells and that ectopic String expression drives cells out of G2 (Neufeld et al., 1998). String (Stg)-overexpressing cells have a very short G2, a long G1, and a nearly normal cell doubling time (Neufeld et al., 1998). If the extended S and G2 phases in dMyc-overexpressing cells reflect compensation for an accelerated G1, we reasoned that coexpression of Stg with dMyc should prevent the G2 elongation and simultaneously shorten the cell cycle. Conversely, if dMyc acts directly to prolong S and/or G2, then overexpressed Stg should shorten G2, but the cells should compensate by extending G1. In this case, the total length of the cell cycle would not be affected. To distinguish between these possibilities, we coexpressed Stg+dMyc in the same cell clones under control of Act>CD2>Gal4 and analyzed the cells by FACS. Compared to cells expressing dMyc alone, the cell cycle profile of Act>dMyc+Stg cells showed a 76% reduction in G2 cells (Figure 6A and Table 2). In addition, the percentage of cells in G1 increased from about 5%–in cells expressing dMyc alone–to 20% (Table 2). In contrast to controls or cells expressing dMyc alone, the doubling time of cells coexpressing dMyc+Stg was dramatically shortened from 12.9 hr to 10.6 hr (Figure 6B). We conclude that overexpression of dMyc in cycling wing disc cells promotes not only their growth but also their progression through G1 and that the observed elongation of S and G2 is an indirect consequence of accelerating G1.
dMyc-Induced Growth Is Independent of Cell Cycle Control
With the same set of Act>dMyc+Stg clones, we quantitated growth rates by measuring clone areas (Figure 6B). Act>dMyc+Stg cells were much smaller than Act> dMyc-expressing cells (Table 2). Nevertheless, the area of Act>dMyc+Stg clones was actually greater than clones expressing dMyc alone (Figure 6B). Calculation of the mass doubling times (see Experimental Procedures) showed that control clones doubled their mass in 12.9 hr and thus kept pace with cell division (cell DT = 12.9 hr; Figure 6B). However, Act>dMyc clones doubled their mass in 10.9 hr, faster than the cells divided. Act>dMyc+Stg clones doubled their mass in 10.2 hr and divided every 10.6 hr (Figure 6B). Therefore, although the faster cell cycle time yielded more cells in the Act>dMyc+Stg clones, the total clonal mass, and thus overall growth rate, remained the same as in Act> dMyc clones. This result provides direct evidence that dMyc promotes cellular growth. Moreover, it demonstrates that dMyc’s effect on growth is independent of its alteration of cell cycle phasing. Finally, it shows that although dMyc levels affect the length of G1, dMyc-induced growth is unable to deregulate G2 control in wing disc cells.
dmyc Is Regulated by the Disc Patterning System, and Its Ectopic Expression Can Prevent Cell Cycle Arrest
As a second test of how dmyc affects the cell cycle, we examined a population of arrested cells in the wing disc. dmyc mRNA accumulated to variable levels in proliferating wing disc cells but was not present in cells that had exited the cell cycle, such as a “zone of nonproliferating cells” (ZNC) that straddles the dorsal–ventral boundary of the disc (Figure 7D). This ZNC will differentiate the sensory bristles and hairs of the adult wing margin (O’Brochta and Bryant, 1985). Cells of the ZNC dramatically slow their growth and exit the cell cycle late during the third larval instar (O’Brochta and Bryant, 1985; Johnston and Edgar, 1998). We previously showed that the patterning gene wingless (wg), a member of the Wnt gene family and the primary pattern organizer at the dorsoventral (D/V) boundary in the wing, is required for both cell cycle and growth arrests in the ZNC (Phillips and Whittle, 1993; Johnston and Edgar, 1998). Therefore, we first asked whether Wg activity repressed dmyc expression in the ZNC. Using C96>Gal4, which is ex pressed specifically in the ZNC, we blocked the activity of Wg in these cells by expressing a dominant-negative form of dTCF, a DNA-binding protein required for Wg signal transduction (van de Wetering et al., 1997). This treatment prevents the cell cycle arrest (Johnston and Edgar, 1998) and also resulted in induction of dmyc mRNA in these cells (Figure 7C). Thus, like the cell cycle and growth arrests of the ZNC, dmyc expression is regulated by the wg dorsal–ventral patterning system of the disc.
The observation that wg negatively regulates the expression of dmyc in the ZNC suggested that the absence of dmyc mRNA in these cells might be a prerequisite for their cell cycle and growth arrests. To determine whether ectopic dMyc could bypass cell cycle arrest in the ZNC, we expressed dMyc using C96>Gal4 and labeled discs with the S phase marker BrdU. The cell cycle arrest of the ZNC includes a G2 arrest in anterior cells flanking the D/V boundary and a G1 arrest in the anterior cells at the D/V border as well as in all posterior cells (Johnston and Edgar, 1998). C96>dMyc-expressing discs had ectopic S phases in the ZNC at all time points examined (Figure 7E) and by FACS showed an increase in S and G2 cells (not shown). Interestingly, ectopic expression of dMyc prevented only the G1 arrest, as the anterior cells flanking the D/V boundary still arrested in G2. Since expression from the C96>Gal4 driver is activated before cells of the ZNC exit the cycle (Johnston and Edgar, 1998), dMyc expressed from this driver may prevent them from exiting the cycle in the first place. Expression of a heat shock (HS)-controlled dMyc transgene did not push previously arrested cells back into cycle, although HS-dE2F and HS–Cyclin E were able to do so (Johnston and Edgar, 1998). This suggests that dMyc is able to prevent cycling wing disc cells from exiting the cycle but is unable to reactivate cells that are already quiescent. Finally, overexpression of dMyc in the ZNC also resulted in a significant increase in the FSC values compared to control ZNC cells (data not shown). Therefore, in addition to blocking the cell cycle arrest of these cells, ectopic dMyc also prevents their growth arrest.
Discussion
dmyc Regulates Growth
A major gap in our understanding of the myc proto oncogene is the nature of Myc’s primary function in cellular physiology. Here we present genetic evidence that cellular growth, defined as accumulation of cell mass, is highly responsive to dmyc levels during Drosophila development. Like the original dmycdm1 allele, two novel loss-of-function alleles of dmyc generate flies with reduced body size and smaller cells. Both the dmycP0 and dmycP1 mutants take longer to develop but nevertheless are able to reach adult stages. However, a striking growth disadvantage is revealed when dmyc mutant cells are placed in competition with nonmutant cells. This disadvantage may stem from reduced cell survival, a slower cell cycle, or both. We countered the growth disadvantage of dmyc−/− cells by expressing a dmyc transgene in the mosaic wing discs, suggesting that subthreshold levels of dmyc are at the root of the defect. Consistent with these findings, overexpressed dmyc is sufficient to promote cell growth in wild-type wing discs. Cells expressing dMyc are substantially larger than control cells, and we demonstrate that the increase in cell size is a direct result of an augmented growth rate. Significantly, neither loss of dmyc nor its overexpression causes pattern abnormalities. Together, our results argue that appropriate levels of dmyc are crucial for maintaining normal cell and body size during Drosophila development and that both of these effects are mediated by regulation of cellular growth.
Cell Cycle Effects of dmyc
The cell cycle profile of cells overexpressing dMyc is remarkably similar to that of cells overexpressing Cyclin E. In both cases, the G1 phase is virtually absent, but the cycle is not accelerated because S and G2 are extended in compensation. However, while overexpressed dMyc makes cells larger, Cyclin E overexpression results in cells that are smaller than normal (Table 2). This indicates that the increased growth promoted by dMyc is not just due to extension of G2, when cells have a doubled genome and thus a greater biosynthetic capacity.
Does dMyc overexpression shorten G1 by promoting cellular growth? Our observations argue that it does. Since Cyclin E activity controls the duration of G1 in wing disc cell cycles (Neufeld et al., 1998), the increased growth driven by dMyc is likely to result in upregulation of Cyclin E activity. However, dMyc overexpression does not detectably alter levels of cyclin E mRNA in wing discs (our unpublished data), suggesting that dMyc may control Cyclin E activity posttranscriptionally. Conversely, the low levels of dmyc in the dmyc mutants may slow growth and delay attainment of a critical threshold of Cyclin E. Slower growth could also result in small cells and the competitive disadvantage that we observed.
It seems paradoxical that dMyc-induced growth can accelerate G1 but is insufficient to drive a faster cell cycle. Our data indicate that this is because the G2/M regulator Stg/Cdc25 is still limiting in these cell cycles, as it is in normal disc cells and in those overexpressing Cyclin E (Neufeld et al., 1998). Consistent with this conclusion, dMyc overexpression does not alter stg mRNA expression (our unpublished data). Consequently, under conditions where the length of G1 is not limited (e.g., when dMyc is overexpressed), stg expression controls the length of the cell cycle. Transcriptional regulation of stg in imaginal discs is complex and, at least in some cases, is controlled by developmental mechanisms that organize pattern (e.g., Thomas et al., 1994; Milan et al., 1996a, 1996b; Johnston and Edgar, 1998; Lehman et al., 1999).
dMyc’s ability to augment cellular growth but not cell cycle rates differs markedly from the properties of the transcription factor dE2F. Overexpression of dE2F in wing discs accelerates the cell cycle but not cellular growth (Neufeld et al., 1998). Our previous study of dE2F’s role in wing growth indicated that dE2F drives faster cell cycles because it increases both cyclin E and stg expression (Neufeld et al., 1998). This study raised the possibility that dE2F activity, if modulated according to growth rates, could act to couple cellular growth to rates of cell division (Neufeld et al., 1998). However, our current data imply that Cyclin E activity, rather than dE2F, responds to dMyc-induced growth and is thus a more likely “growth sensor.” Perhaps Cyclin E levels are translationally controlled and vary according to the cell’s growth rate in a manner similar to regulation of the budding yeast G1 cyclin Cln 3 (Polymenis and Schmidt, 1999). The expression of stg in wing discs is apparently not regulated by dMyc-induced cell growth. Instead, stg is controlled independently, probably by the patterning system (Johnston and Edgar, 1998). Using Cyclin E as a “growth sensor” and Stg/Cdc25 as a “pattern sensor” could be advantageous, since it would allow independent integration of the diverse factors that influence disc growth, including patterning signals, growth factors, and nutritional conditions. Our data predict that in cell cycles regulated solely in G1, dmyc might determine the length of the cell cycle. In cells with independent G2 regulation, however, such as those occurring late in wing disc development, the duration of the cell cycle is independent of dmyc and depends upon Stg/Cdc25.
The correlation between the loss of dmyc expression in the ZNC and the Wingless-dependent cell cycle and growth arrests in these cells is striking. Given that forced expression of dmyc in these cells allows both cellular growth and cell division, we postulate that repression of dmyc is crucial to their exit from the cycle. However, while ectopic dMyc alleviated the G1 arrest, the G2 arrest still occurred, again illustrating dMyc-independent G2 control. The relationship between dMyc and Wingless, a major pattern organizer of the wing disc, is especially compelling in that the molecules controlling three distinct processes–pattern, growth, and cell division–are deployed into a cross-talking network that regulates disc size (i.e., cell size and number) and shape (Figure 7F). Our results are an interesting contrast to a previous report showing that the Wnt signaling pathway could enhance expression of a c-myc reporter construct in a colon carcinoma cell line (He et al., 1998).
How Does dmyc Regulate Growth?
While a number of the candidate vertebrate Myc gene targets have been linked to cell cycle control, immortalization, adhesion, metastasis, and stress response, the majority have been construed as being involved in cell growth and metabolism (Grandori and Eisenman, 1997; Dang, 1999; Polymenis and Schmidt, 1999). In Drosophila, only one candidate dmyc-regulated gene has been reported, pitchoune (pit), a homolog of a previously identified mammalian c-Myc target, MrDb (Grandori et al., 1996; Zaffran et al., 1998). Both MrDb and Pit are DEAD box RNA helicases, a class of proteins known in yeast to be involved in translation initiation and ribosomal RNA processing. pit1 mutant flies do not grow beyond the first larval instar (Zaffran et al., 1998). Pit localizes to the nucleolus (Zaffran et al., 1998) and thus may contribute to growth and cell division by mediating ribosome assembly and facilitating translation. In searching the Drosophila database, we found that to date all molecularly characterized mutations with the combination of delayed development, small body size, thin bristles, and decreased viability encode genes involved in metabolism or protein synthesis (Flybase). Significantly, dmyc is the only known transcription factor with this “Minute”-like phenotype. These phenotypic similarities may reflect a role for dMyc in transactivating the genes involved in protein synthesis and metabolism. Our work predicts that future searches for dMyc targets will identify genes that directly impinge upon growth and metabolism. The preponderance of vertebrate Myc target genes related to growth and metabolism suggests that this role is conserved in vertebrates as well (Grandori and Eisenman, 1997; Dang, 1999; Polymenis and Schmidt, 1999).
Myc and Cancer
Our findings linking dmyc to cell growth control have implications for vertebrate Myc function. Both c-myc and N-myc are necessary for organ development in embryos, and mice homozygous for null mutations in either gene are significantly developmentally retarded (Charron et al., 1993; Davis et al., 1993; Sawai et al., 1993; Stanton et al., 1993). Mouse embryos with N-myc hypomorphic mutations produce smaller but normally patterned organs (Moens et al., 1992), mirroring the defects found in the dmyc hypomorphs, but it is not clear whether the mouse phenotypes result from reduced cell size, cell number, or both. However, in Rat1 cells, homozygous deletion of c-myc considerably slowed cell division and reduced biosynthetic rates nearly 3-fold (Mateyak et al., 1997). Furthermore, c-myc overexpression in a human B cell line produces an increase in cell mass independent of cell division (Schuhmacher et al., submitted), and B cells from mice expressing c-myc under Eμ immunoglobulin enhancer control are significantly larger than B cells from littermate controls (Iritani and Eisenman, submitted). These are intriguing parallels with our results in Drosophila and lead us to postulate that Myc’s highly conserved role is to potentiate cell division by directly modulating the expression of genes required for cell growth. myc is continuously expressed in dividing cells (Hann et al., 1985), and its levels are exquisitely responsive to external signals (Kelly et al., 1983; Roussel et al., 1991; Kessler et al., 1992); thus, Myc may monitor and integrate information from the cell’s environment and couple this information to a cell growth response.
Deregulation of vertebrate myc expression has been implicated in many types of cancer. However, myc overexpression alone is usually insufficient to provoke malignant transformation. Cooperating oncogenes, such as activated ras or pim-1, are required with myc to obtain deregulated cell division and to bypass apoptosis. Cooperative transformation may involve a Myc-induced increase in biosynthesis first, and second, an alteration in cell identity that would include loss of G2 control. The high frequency of Myc rearrangements in a broad range of cancers may relate to the ability of deregulated Myc to provide the fuel for uncontrolled cell division in many cell types.
Experimental Procedures
Fly Strains
The following genotypes were used in these experiments:
Oregon R
w; iso2; 3
dmycP0 (orP1)/FM7c
dmycP0 (orP1) FRT18A/FM7c
wFRT18A HS-πmyc; MKRSFlp/TM6B
wFRT18A HS-πmyc; En>Gal4;MKRSFlp/SM6;TM6B
w; UAS-dMyc42 (Zaffran et al., 1998)
w; UAS-GFP and w; UAS-Stg (Neufeld et al., 1998)
w; UAS-P35 (Hay et al., 1994) w; UAS-CycE (C. Lehner)
w; UAS-dMyc42, Stg
w; UAS-dTCFΔN1 (van de Wetering et al., 1997)
w; En>Gal4, UAS-GFP (Neufeld et al., 1998)
yw; C96>Gal4, UAS-GFP
w; Actin5C>CD2>Gal4, UAS-GFP (Neufeld et al., 1998)
yw HS-Flp122 w; HS-dMyc
dmyc Genomic Analysis
The intron–exon boundaries shown in Figure 1A were determined by comparing a partial genomic sequence with previously isolated dmyc cDNAs (Gallant et al., 1996). The P element insertion strain P{ry+t7.2=P-Sal}I35/C(1)DX, yf; bw; st (Bloomington stock #P1298) contains a P element insertion 99 nt upstream of the longest isolated cDNA clone (Gallant et al., 1996) and 28–32 nt upstream of four separate 5′ ESTs (LD32538, LD32539, LD13406, LD28461; Berkeley Drosophila Genome Project); this mutant was renamed dmycP0. Pelement excisions of dmycP0 were obtained according to standard procedures (Ashburner, 1989) and identified by the loss of ry+. In more than 175 independent “hops,” deletions of the dmyc locus were never recovered, possibly because the P element inserted in dmycP0 was engineered to produce a dominant suppressor of P-transposase activity. However, occasionally the loss of the ry+ marker was associated with an internal deletion within the P element. One of these lines displayed more severe defects than dmycP0 and was named dmycP1.
Mitotic Recombination
Mitotic recombination was induced using the Flp-FRT method (Xu and Rubin, 1993). To induce the clones, larvae were heat shocked for 1.5 hr at 37°C at 48 or 72 hr after egg deposition (AED) and dissected at 120 hr AED.
Flow Cytometry
FACS analysis was as described (Neufeld et al., 1998). For analysis of dmyc mutants, approximately 10 to 20 wing discs were dissected from both mutant and wild-type control wandering third instar larvae, carefully staged by their morphology before dissociation. Analysis was carried out with a Becton Dickinson FACS Vantage 2 and data analyzed with Cell Quest (Becton Dickinson) and Multicycle AV (Phoenix Flow Systems) software.
Proliferation and Growth Rate Measurements
Gal4-expressing clones were induced as described (Neufeld et al., 1998). Images of discs were captured with a Bio-Rad MRC-600 confocal microscope and analyzed with Photoshop software. Clone areas were measured from digital images with the Histogram function. Cell doubling times were calculated according to the equation [log2/logN][hr]. Mass doubling times (mDT) were calculated as mDT = [ln2][hr]/ln[final clone area/area of one cell].
Immunocytochemistry
Discs were fixed and BrdU labeling was done with mouse anti-BrdU from Becton Dickinson as in Johnston and Edgar (1998). Cell membranes were stained with rhodamine-phalloidin (Molecular Probes). Discs were mounted in Fluoroguard (BioRad). Apoptosis was visualized as in Neufeld et al. (1998). Loss-of-function clones were detected using 9E10 antibodies at 1:50 (Oncogene Science) and FITC- or Cy3-conjugated secondary antibodies, used at 1:300 and 1:600, respectively. Electron micrography was performed using a JEOL 5800 scanning electron microscope.
Acknowledgments
We thank members of the Edgar and Eisenman labs for discussions during the course of the work; S. Parkhurst for advice and resources; A. de la Cruz, P. F. Cheng, A. Berger, L. Caldwell, and K. Seidel for technical assistance; and M. Groudine, E. Hafen, T. Neufeld, and J. Roberts for comments on the manuscript. Work in the Edgar lab is supported by the National Institutes of Health, and support for the Eisenman lab comes from the National Cancer Institute. L. A. J. was supported by NIH funding to G. Schubiger and P. G. by the Swiss National Science Foundation. B. A. E. is a Rita Allen Scholar, and R. N. E. is a Research Professor of the American Cancer Society.
References
- Amati B (1998). Myc and the cell cycle. Front. Biosci 3, 250–268. [DOI] [PubMed] [Google Scholar]
- Amati B, and Land H (1994). Myc-Max-Mad: a transcription factor network controlling cell cycle progression, differentiation and death. Curr. Opin. Genet. Dev 4, 102–108. [DOI] [PubMed] [Google Scholar]
- Armelin HA, Armelin MCS, Kelly K, Stewart T, Leder P, Cochran BH, and Stiles CD (1984). Functional role for c-myc in mito genic response to platelet-derived growth factor. Nature 310, 655–660. [DOI] [PubMed] [Google Scholar]
- Ashburner M (1989). Drosophila, a Laboratory Handbook (New York: Cold Spring Harbor Press; ). [Google Scholar]
- Blackwood EM, Kretzner L, and Eisenman RN (1992). Myc and Max function as a nucleoprotein complex. Curr. Opin. Genet. Dev 2, 227–235. [DOI] [PubMed] [Google Scholar]
- Böhni R, Riesgo-Escovar J, Oldham S, Brogiolo W, Stocker H, Andruss BF, Beckingham K, and Hafen E (1999). Autonomous control of cell and organ size by CHICO, a Drosophila homolog of vertebrate IRS1–4. Cell 97, 865–876. [DOI] [PubMed] [Google Scholar]
- Charron J, Malynn BA, Fisher P, Stewart V, Jeannotte L, Goff SP, Robertson EJ, and Alt FW (1993). Embryonic lethality in mice homozygous for a targeted disruption of the N-myc gene. Genes Dev. 6, 2248–2257. [DOI] [PubMed] [Google Scholar]
- Conlon I, and Raff M (1999). Size control in animal development. Cell 96, 235–244. [DOI] [PubMed] [Google Scholar]
- Craig RW, Buchan HL, Civin CI, and Kastan MB (1993). Al tered cytoplasmic/nuclear distribution of the c-myc protein in differ entiating ML-1 human myeloid leukemia cells. Cell Growth Differ. 4, 349–357. [PubMed] [Google Scholar]
- Dang CV (1999). cMyc target genes involved in cell growth, apoptosis, and metabolism. Mol. Cell. Biol 19, 1–11. [DOI] [PMC free article] [PubMed] [Google Scholar]
- Davis AC, Wims M, Spotts GD, Hann SR, and Bradley A (1993). A null c-myc mutation causes lethality before 10.5 days of gestation in homozygous and reduced fertility in heterozygous female mice. Genes Dev. 7, 671–682. [DOI] [PubMed] [Google Scholar]
- Downs KM, Martin GR, and Bishop JM (1989). Contrasting patterns of myc and N-myc expression during gastrulation of the mouse embryo. Genes Dev. 3, 860–869. [DOI] [PubMed] [Google Scholar]
- Eilers M, Schirm S, and Bishop JM (1991). The MYC protein activates transcription of the α-prothymosin gene. EMBO J. 10, 133–141. [DOI] [PMC free article] [PubMed] [Google Scholar]
- Galaktionov K, Chen X, and Beach D (1996). Cdc25 cell-cycle phosphatase as a target of c-myc. Nature 382, 511–517. [DOI] [PubMed] [Google Scholar]
- Gallant P, Shiio Y, Cheng PF, Parkhurst SM, and Eisenman RN (1996). Myc and Max homologs in Drosophila. Science 274, 1523–1527. [DOI] [PubMed] [Google Scholar]
- García-Bellido A, and Merriam JR (1971). Parameters of the wing imaginal disc development of Drosophila melanogaster. Dev. Biol 24, 61–87. [DOI] [PubMed] [Google Scholar]
- Grandori C, and Eisenman RN (1997). Myc target genes. Trends Biochem. 22, 177–181. [DOI] [PubMed] [Google Scholar]
- Grandori C, Mac J, Siebelt F, Ayer DE, and Eisenman RN (1996). Myc-Max heterodimers activate a DEAD box gene and interact with multiple E box-related sites in vivo. EMBO J. 15, 4344–4357. [PMC free article] [PubMed] [Google Scholar]
- Hann SR, Thompson CB, and Eisenman RN (1985). c-myc oncogene protein synthesis is independent of the cell cycle in human and avian cells. Nature 314, 366–369. [DOI] [PubMed] [Google Scholar]
- Hay BA, Wolff T, and Rubin GM (1994). Expression of baculovirus P35 prevents cell death in Drosophila. Development 120, 2121–2129. [DOI] [PubMed] [Google Scholar]
- He T-C, Sparks AB, Rago C, Hermeking H, Zawel L, da Costa LT, Morin PJ, Vogelstein B, and Kinzler KW (1998). Identification of cMyc as a target of the APC pathway. Science 281, 1509–1512. [DOI] [PubMed] [Google Scholar]
- Heikkila R, Schwab G, Wickstrom E, Loke SL, Pluznik DH, Watt R, and Neckers LM (1987). c-myc antisense oligodeoxy-nucleotide inhibits entry into S phase but not progress from G0 to G1. Nature 328, 445–449. [DOI] [PubMed] [Google Scholar]
- Henriksson M, and Luscher B (1996). Proteins of the Myc network: essential regulators of cell growth and differentiation. Adv. Cancer Res 68, 109–182. [DOI] [PubMed] [Google Scholar]
- Johnston LA, and Edgar BA (1998). Wingless and Notch regulate cell-cycle arrest in the developing Drosophila wing. Nature 394, 82–84. [DOI] [PMC free article] [PubMed] [Google Scholar]
- Karn J, Watson JV, Lowe AD, Green SM, and Vedeckis W (1989). Regulation of cell cycle duration by c-myc levels. Oncogene 4, 773–787. [PubMed] [Google Scholar]
- Kelly K, Cochran BH, Stiles CD, and Leder P (1983). Cell-specific regulation of the c-myc gene by lymphocyte mitogens and platelet-derived growth factor. Cell 35, 603–610. [DOI] [PubMed] [Google Scholar]
- Kessler DJ, Duyao MP, Spicer DB, and Sonenshein GE (1992). NF-kappa B-like factors mediate interleukin 1 induction of c-myc gene transcription in fibroblasts. J. Exp. Med 176, 787–792. [DOI] [PMC free article] [PubMed] [Google Scholar]
- Lambertsson A (1998). The Minute genes in Drosophila and their molecular functions. Adv. Genet 38, 69–134. [DOI] [PubMed] [Google Scholar]
- Lehman DA, Patterson B, Johnston LA, Balzer T, Britton JS, Saint R, and Edgar BA 1999. Cis-regulatory elements of the mitotic inducer, string/Cdc25. Development 126, 1793–1803. [DOI] [PMC free article] [PubMed] [Google Scholar]
- Leone G, DeGregori J, Sears R, Jakol L, and Nevins JR (1997). Myc and Ras collaborate in inducing accumulation of active cyclin E/Cdk2 and E2F. Nature 387, 422–426. [DOI] [PubMed] [Google Scholar]
- Li L, Nerlov K, Prendergast G, MacGregor D, and Ziff EB (1994). c-Myc represses transcription in vivo by a novel mechanism dependent on the initiator element and Myc box II. EMBO J. 13, 4070–4079. [DOI] [PMC free article] [PubMed] [Google Scholar]
- Mateyak MK, Obaya AJ, Adachi S, and Sedivy JM (1997). Phenotypes of c-Myc-deficient rat fibroblasts isolated by targeted homologous recombination. Cell Growth Differ. 8, 1039–1048. [PubMed] [Google Scholar]
- McCabe J, French V, and Partridge L (1997). Joint regulation of cell size and cell number in the wing blade of Drosophila melanogas ter. Genet. Res 69, 61–68. [DOI] [PubMed] [Google Scholar]
- Milan M, Campuzano S, and García-Bellido A (1996a). Cell cy cling and patterned cell proliferation in the wing primordium of Drosophila. Proc. Natl. Acad. Sci. USA 93, 640–645. [DOI] [PMC free article] [PubMed] [Google Scholar]
- Milan M, Campuzano S, and García-Bellido A (1996b). Cell cy cling and patterned cell proliferation in the Drosophila wing during metamorphosis. Proc. Natl. Acad. Sci. USA 93, 11687–11692. [DOI] [PMC free article] [PubMed] [Google Scholar]
- Moens CB, Auerbach AB, Conlon RA, Joyner AL, and Rossant J (1992). A targeted mutation reveals a role for N-myc in branching morphogenesis in the embryonic mouse lung. Genes Dev. 6, 691–704. [DOI] [PubMed] [Google Scholar]
- Morata G, and Ripoll P (1975). Minutes: mutants of Drosophila autonomously affecting cell division rate. Dev. Biol 42, 211–221. [DOI] [PubMed] [Google Scholar]
- Neufeld T, de la Cruz A, Johnston LA, and Edgar BA (1998). Coordination of growth and cell division in the Drosophila wing. Cell 93, 1183–1193. [DOI] [PubMed] [Google Scholar]
- O’Brochta DA, and Bryant PJ (1985). A zone of non-proliferating cells at a lineage restriction boundary in Drosophila. Nature 313, 138–141. [DOI] [PubMed] [Google Scholar]
- Phillips RG, and Whittle JR (1993). wingless expression mediates determination of peripheral nervous system elements in late stages of Drosophila wing disc development. Development 118, 427–438. [DOI] [PubMed] [Google Scholar]
- Pignoni F, and Zipursky S (1997). Induction of Drosophila eye development by decapentaplegic. Development 124, 271–278. [DOI] [PubMed] [Google Scholar]
- Polymenis M, and Schmidt EV (1999). Coordination of cell growth with cell division. Curr. Opin. Genet. Dev 9, 76–80. [DOI] [PubMed] [Google Scholar]
- Raff MC (1996). Size control: the regulation of cell numbers in animal development. Cell 86, 173–175. [DOI] [PubMed] [Google Scholar]
- Roussel MF, Cleveland JL, Shurtleff SA, and Sherr CJ (1991). Myc rescue of a mutant CSF-1 receptor impaired in mitogenic signaling. Nature 353, 361–363. [DOI] [PubMed] [Google Scholar]
- Sawai S, Shimono A, Wakamatsu Y, Palmes C, Hanaoka K, and Kondoh H (1993). Defects of embryonic organogenesis resulting from targeted disruption of the N-myc gene in the mouse. Development 117, 1445–1455. [DOI] [PubMed] [Google Scholar]
- Schreiber-Agus N, Stein D, Chen K, Goltz JS, Stevens L, and DePinho RA (1997). Drosophila Myc is oncogenic in mammalian cells and plays a role in the diminutive phenotype. Proc. Natl. Acad. Sci. USA 94, 1235–1240. [DOI] [PMC free article] [PubMed] [Google Scholar]
- Simpson P, and Morata G (1981). Differential mitotic rates and patterns of growth in compartments in the Drosophila wing. Dev. Biol 85, 299–308. [DOI] [PubMed] [Google Scholar]
- Sorrentino V, Drozdoff V, McKinney MD, Zeitz L, and Fleissner E (1986). Potentiation of growth factor activity by exogenous c-myc expression. Proc. Natl. Acad. Sci. USA 83, 8167–8171. [DOI] [PMC free article] [PubMed] [Google Scholar]
- Stanton BR, Perkins AS, Tessarollo L, Sassoon DA, and Par ada LF (1993). Loss of N-myc function results in embryonic lethality and failure of the epithelial component of the embryo to develop. Genes Dev. 6, 2235–2247. [DOI] [PubMed] [Google Scholar]
- Stern DL, and Emlen DJ (1999). The developmental basis for allometry in insects. Development 126, 1091–1101. [DOI] [PubMed] [Google Scholar]
- Stern D, Roberts A, Roche NS, Sporn MB, and Weinberg RA (1986). Differential responsiveness of myc and ras-transfected cells to growth factors: selective stimulation of myc-transfected cells by epidermal growth factor. Mol. Cell. Biol 6, 870–877. [DOI] [PMC free article] [PubMed] [Google Scholar]
- Struhl G, and Basler K (1993). Organizing activity of Wingless protein in Drosophila. Cell 72, 527–540. [DOI] [PubMed] [Google Scholar]
- Thomas BJ, Gunning DA, Cho J, and Zipursky SL (1994). Cell cycle progression in the developing eye: roughex encodes a novel protein required for the establishment of G1. Cell 77, 1003–1014. [DOI] [PubMed] [Google Scholar]
- van de Wetering M, Cavallo R, Dooijes D, van Beest M, van Es J, Loureiro J, Ypma A, Hursh D, Jones T, Bejsovec A, et al. (1997). Armadillo coactivates transcription driven by the product of the Drosophila segment polarity gene dTCF. Cell 88, 789–799. [DOI] [PubMed] [Google Scholar]
- Wakamatsu Y, Watanabe Y, Shimono A, and Kondoh H (1993). Transition of localization of the N-Myc protein from nucleus to cytoplasm in differentiating neurons. Neuron 10, 1–9. [DOI] [PubMed] [Google Scholar]
- Xu T, and Rubin GM (1993). Analysis of genetic mosaics in developing and adult Drosophila tissues. Development 117, 1223–1237. [DOI] [PubMed] [Google Scholar]
- Zaffran S, Chartier A, Gallant P, Astier M, Arquier N, Doherty D, Gratecos D, and Semeriva M (1998). A Drosophila RNA heli-case gene, pitchoune, is required for cell growth and proliferation and is a potential target of dMyc. Development 125, 3571–3584. [DOI] [PubMed] [Google Scholar]
- Zornig M, and Evan GI (1996). On target with Myc. Curr. Biol 6, 1553–1556. [DOI] [PubMed] [Google Scholar]