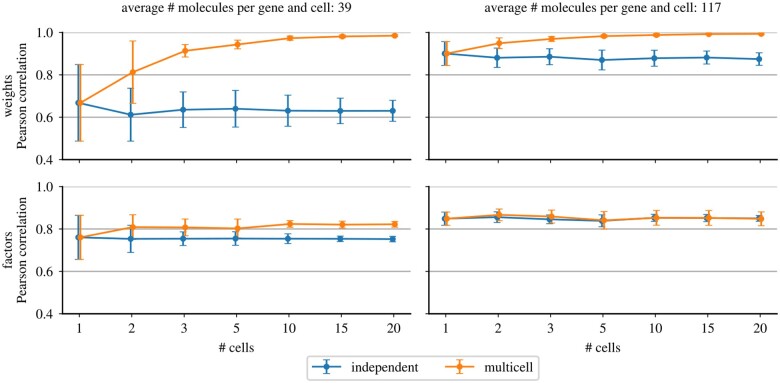
Figure 4.
Pearson’s correlation of inferred and simulated weights (first row) and factors (second row) in 10 simulated datasets of 20 cells with shared weight matrices. In every dataset, a given number of cells (x-axis) were modeled using FISHFactor on all cells jointly (multi-cell, orange) or by applying FISHFactor to individual cells and averaging the results (independent, blue). Error bars show 1 SD of the mean across the 10 datasets. The first column shows results on a dataset with an average molecule count per cell and gene of 39 (), and the second column with an average count of 117 ()

