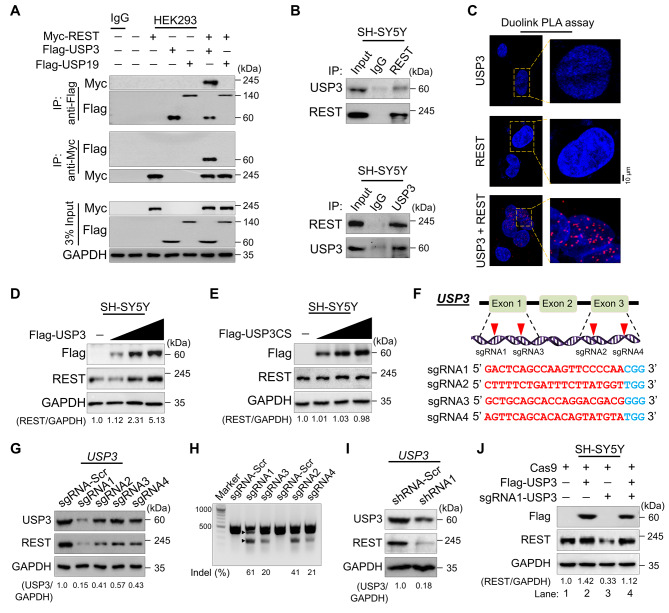
Fig. 3.
USP3 interacts with and increases REST protein levels. (A) The interaction between ectopically transfected Flag-USP3 or Flag-USP19 and Myc-REST proteins were analyzed in HEK293 cells. Cells were immunoprecipitated using indicated antibodies and USP3 and REST protein levels were checked by western blot. (B) The interaction between endogenous USP3 and REST was analyzed in SH-SY5Y cells. Cells were immunoprecipitated using the indicated antibodies and USP3 and REST protein levels were checked by western blot. (C) SH-SY5Y cells were subjected to the Duolink PLA assay to analyze the interaction between USP3 and REST using specific antibodies. The in situ USP3-REST interaction (PLA dots) was observed when USP3 and REST were immunostained together but not when they were stained with individual antibodies. Scale bar: 10 μm. (D) SH-SY5Y cells were transfected with increasing concentrations of Flag-USP3 to validate its effect on endogenous REST protein levels. (E) SH-SY5Y cells were transfected with increasing concentrations of catalytic mutant Flag-USP3CS to validate its effect on endogenous REST protein levels. The protein band intensities for (D-E) were estimated using ImageJ software with reference to the GAPDH control band (REST/GAPDH) and presented below the blot. (F) Schematic representation of the sgRNAs targeting exon 1 and 3 of the USP3 gene. Red arrowheads indicate the positions of sgRNAs that target the top strand. sgRNA sequences are in red font, and PAM sequences are in bold blue font. (G) The efficiency of sgRNAs targeting USP3 by transient co-transfection with Cas9 in SH-SY5Y cells and immunoblotting with USP3 and REST antibodies. The protein band intensities were estimated using ImageJ software with reference to the GAPDH control (USP3/GAPDH) and presented below the blot. (H) The efficiency of sgRNAs targeting USP3 by transient co-transfection with Cas9 in SH-SY5Y cells followed by a T7E1 assay to determine the cleavage efficiency. Samples were resolved on 2% agarose gel. The cleaved band intensity obtained from the T7E1 assay were measured (indel %) using ImageJ software. Scrambled sgRNA transfected SH-SY5Y cells were used as control cells. The black arrowhead indicate the cleaved PCR amplicons. (I) SH-SY5Y cells were transfected with shRNA targeting USP3, and the endogenous protein levels of USP3 and REST were checked by western blotting. The protein band intensities were estimated using ImageJ software with reference to the GAPDH control band (USP3/GAPDH) and presented below the blot. (J) The effect of reconstitution of Flag-USP3 on endogenous REST protein in USP3-depleted SH-SY5Y cells was validated. The protein band intensities were estimated using ImageJ software with reference to the GAPDH control band (REST/GAPDH) and presented below the blots

