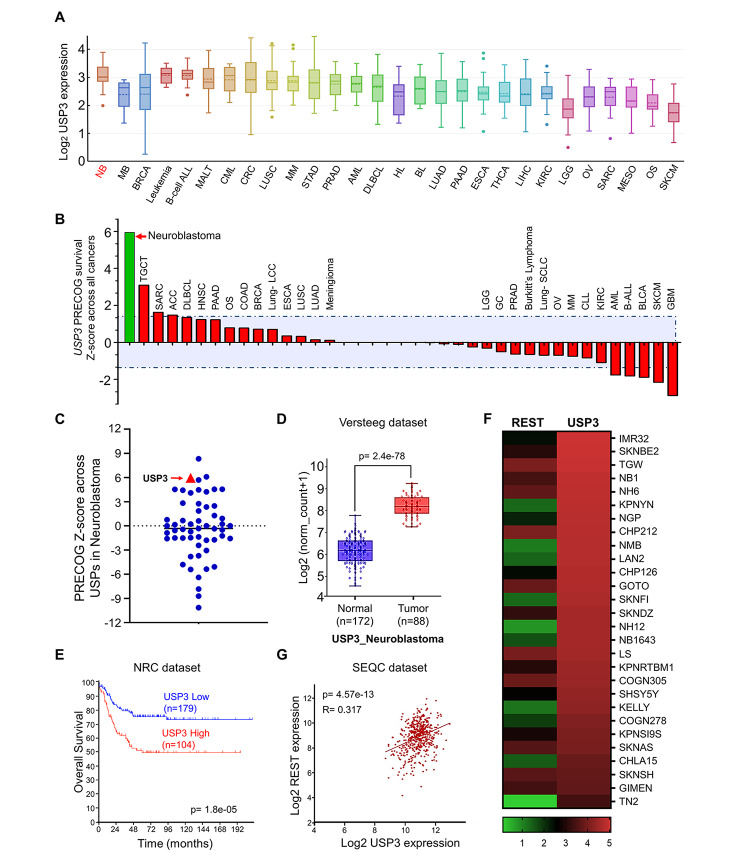
Fig. 4.
USP3 is associated with poor prognosis and survival in neuroblastoma patients. (A) Pan-cancer comparison analysis of USP3 mRNA expression in several cancer types using the Cancer Cell Line Encyclopedia (CCLE) database. NB: Neuroblastoma; MB: Medulloblastoma; BRCA: Breast cancer; ALL: Acute lymphoblastic leukemia; MALT: mucosa associated lymphoid tissue; CML: Chronic myelogenous leukemia; CRC: Colorectal cancer; LUSC: Lung squamous cell carcinoma; MM: Multiple myeloma; STAD: Stomach adenocarcinoma; PRAD: Prostate adenocarcinoma; AML: Acute myeloid leukemia; DLBCL: Diffuse large B-cell lymphoma; HL: Hodgkin’s lymphoma; BL: Burkitt lymphoma; LUAD: Lung adenocarcinoma; PAAD: Pancreatic adenocarcinoma; ESCA: Esophageal carcinoma; THCA: Thyroid carcinoma; LIHC: Liver hepatocellular carcinoma; KIRC: Kidney renal clear cell carcinoma; LGG: Brain low grade glioma; OV: Ovarian serous cystadenocarcinoma; SARC: Ewings sarcoma; MESA: Mesothelioma; OS: Osteosarcoma; SKCM: Skin cutaneous melanoma. The box plots were generated using Xenabrowser (https://xenabrowser.net/). (B) Prediction of Clinical Outcomes from Genomic Profile (PRECOG) meta Z-score of USP3 across different cancer subtypes using a cutoff of p < 0.05 and a median Z-score > 1.4 and <-1.4. TGCT: Tenosynovial giant cell tumor; SARC: Ewings sarcoma; ACC: Adenoid cystic carcinoma; DLBCL: Diffuse large B-cell lymphoma; HNSC: Head and neck squamous cell cancer; PAAD: Pancreatic adenocarcinoma; OS: Osteosarcoma; COAD: Colon adenocarcinoma; BRCA: Breast cancer; LCC: large cell carcinoma; ESCA: Esophageal carcinoma; LUSC: Lung squamous cell carcinoma; LUAD: Lung adenocarcinoma; LGG: Brain low grade glioma; GC: Gastric cancer; PRAD: Prostate adenocarcinoma; SCLC: Lung small cell carcinoma; OV: Ovarian serous cystadenocarcinoma; MM: Multiple myeloma; CLL: Chronic lymphocytic leukemia; KIRC: Kidney renal clear cell carcinoma; AML: Acute myeloid leukemia; ALL: Acute lymphoblastic leukemia; BLCA: Bladder urothelial carcinoma; SKCM: Skin cutaneous melanoma: GBM: Glioblastoma multiforme. (C) PRECOG meta Z-score for expression of USP family genes in neuroblastoma cancer, p < 0.001. (D) Box plot showing the difference between USP3 expression in normal (n = 172) and tumor (n = 88) tissues using the Versteeg neuroblastoma dataset: p-value = 2.4 e− 78. The box plot was generated using R2: genomic Analysis and Visualization Platform (https://r2.amc.nl) (E) Kaplan-Meier analysis showing overall survival probability of groups with low USP3 expression (n = 179) and high USP3 expression (n = 104) group in a neuroblastoma primary (NRC) dataset consisting of 283 primary neuroblastoma tumors: p-value = 1.8 e− 05. The overall survival graphs was generated using R2: genomic Analysis and Visualization Platform (https://r2.amc.nl) (F) A heat map showing mRNA expression levels of REST and USP3 in neuroblastoma cell lines derived from the CCLE database. Representative samples are arranged from high to low mRNA levels of USP3, and corresponding REST values are sorted. (G) A scatterplot showing the expression between USP3 and REST mRNA levels in SEQC dataset: p-value = 4.57e− 13. Pearson correlations (r) quantifying the relationship between USP3 and REST is given. The scatterplot between REST and USP3 mRNA expression was generated using R2: genomic Analysis and Visualization Platform (https://r2.amc.nl)

