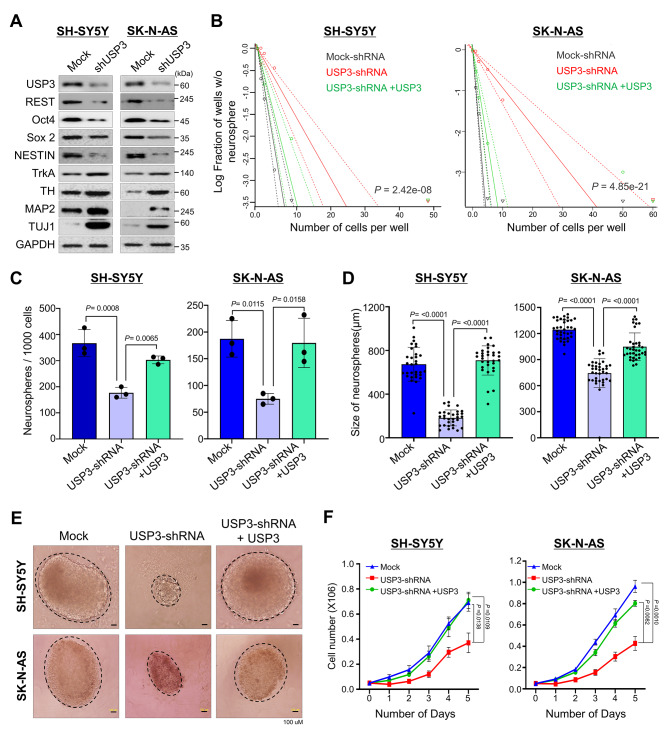
Fig. 5.
Depletion of USP3 affects self-renewal and cell proliferation in neuroblastoma. SH-SY5Y and SK-N-AS neuroblastoma cells transiently transfected with scrambled shRNA (Mock) or USP3 shRNA and USP3-depleted cells reconstituted with USP3 were used to perform the following experiments. (A) Western blot analysis to validate effect of USP3 knockdown on the expression of self-renewal markers in neuroblastoma using the indicated antibodies. GAPDH was used as the loading control. (B) The cells from (A) were used to perform an in vitro neurosphere-forming limiting dilution assay. The cells were dissociated and seeded in low-attachment 96-well plates at cell densities of 1, 2, 5, 10, and 50 cells/well and cultured for 2 weeks in neurosphere forming media. The frequency of neurosphere forming ability was evaluated using ELDA. Data are presented as the mean and standard deviation of at least three independent experiments. The significance of the difference between the indicated groups were determined by the χ2 test, and P values are indicated. (C) The cells from (A) were used to evaluate the effect of USP3 on the neurosphere forming ability in SH-SY5Y and SK-N-AS neuroblastoma cell lines. The cells were dissociated and seeded at density of 2 ⋅ 104 and the number of neurospheres were quantified. Data are presented as the mean and standard deviation of three independent experiments (n = 3). One-way ANOVA followed by Tukey’s post hoc test was used, and P values are indicated. (D) The quantitative analysis of mean size of neurospheres after 2 weeks in neurosphere-forming media. Data are presented as the mean and standard deviation of three independent experiments (n = 3). One-way ANOVA followed by Tukey’s post hoc test was used, and P values are indicated. (E) Representative bright field microscopy images of the neurosphere formation of neuroblastoma cells expressing control shRNA, USP3 shRNA, and USP3 shRNA + USP3. Scale bar = 100 µM. (F) The SH-SY5Y and SK-N-AS cells from (A) were seeded in 6-well plates at density of 0.05 ⋅ 106 cells/well. The cells were harvested and counted at indicated time points. Data are presented as the mean and standard deviation of three independent experiments (n = 3). Two-way ANOVA followed by Tukey’s post hoc test was used, and P values are indicated

