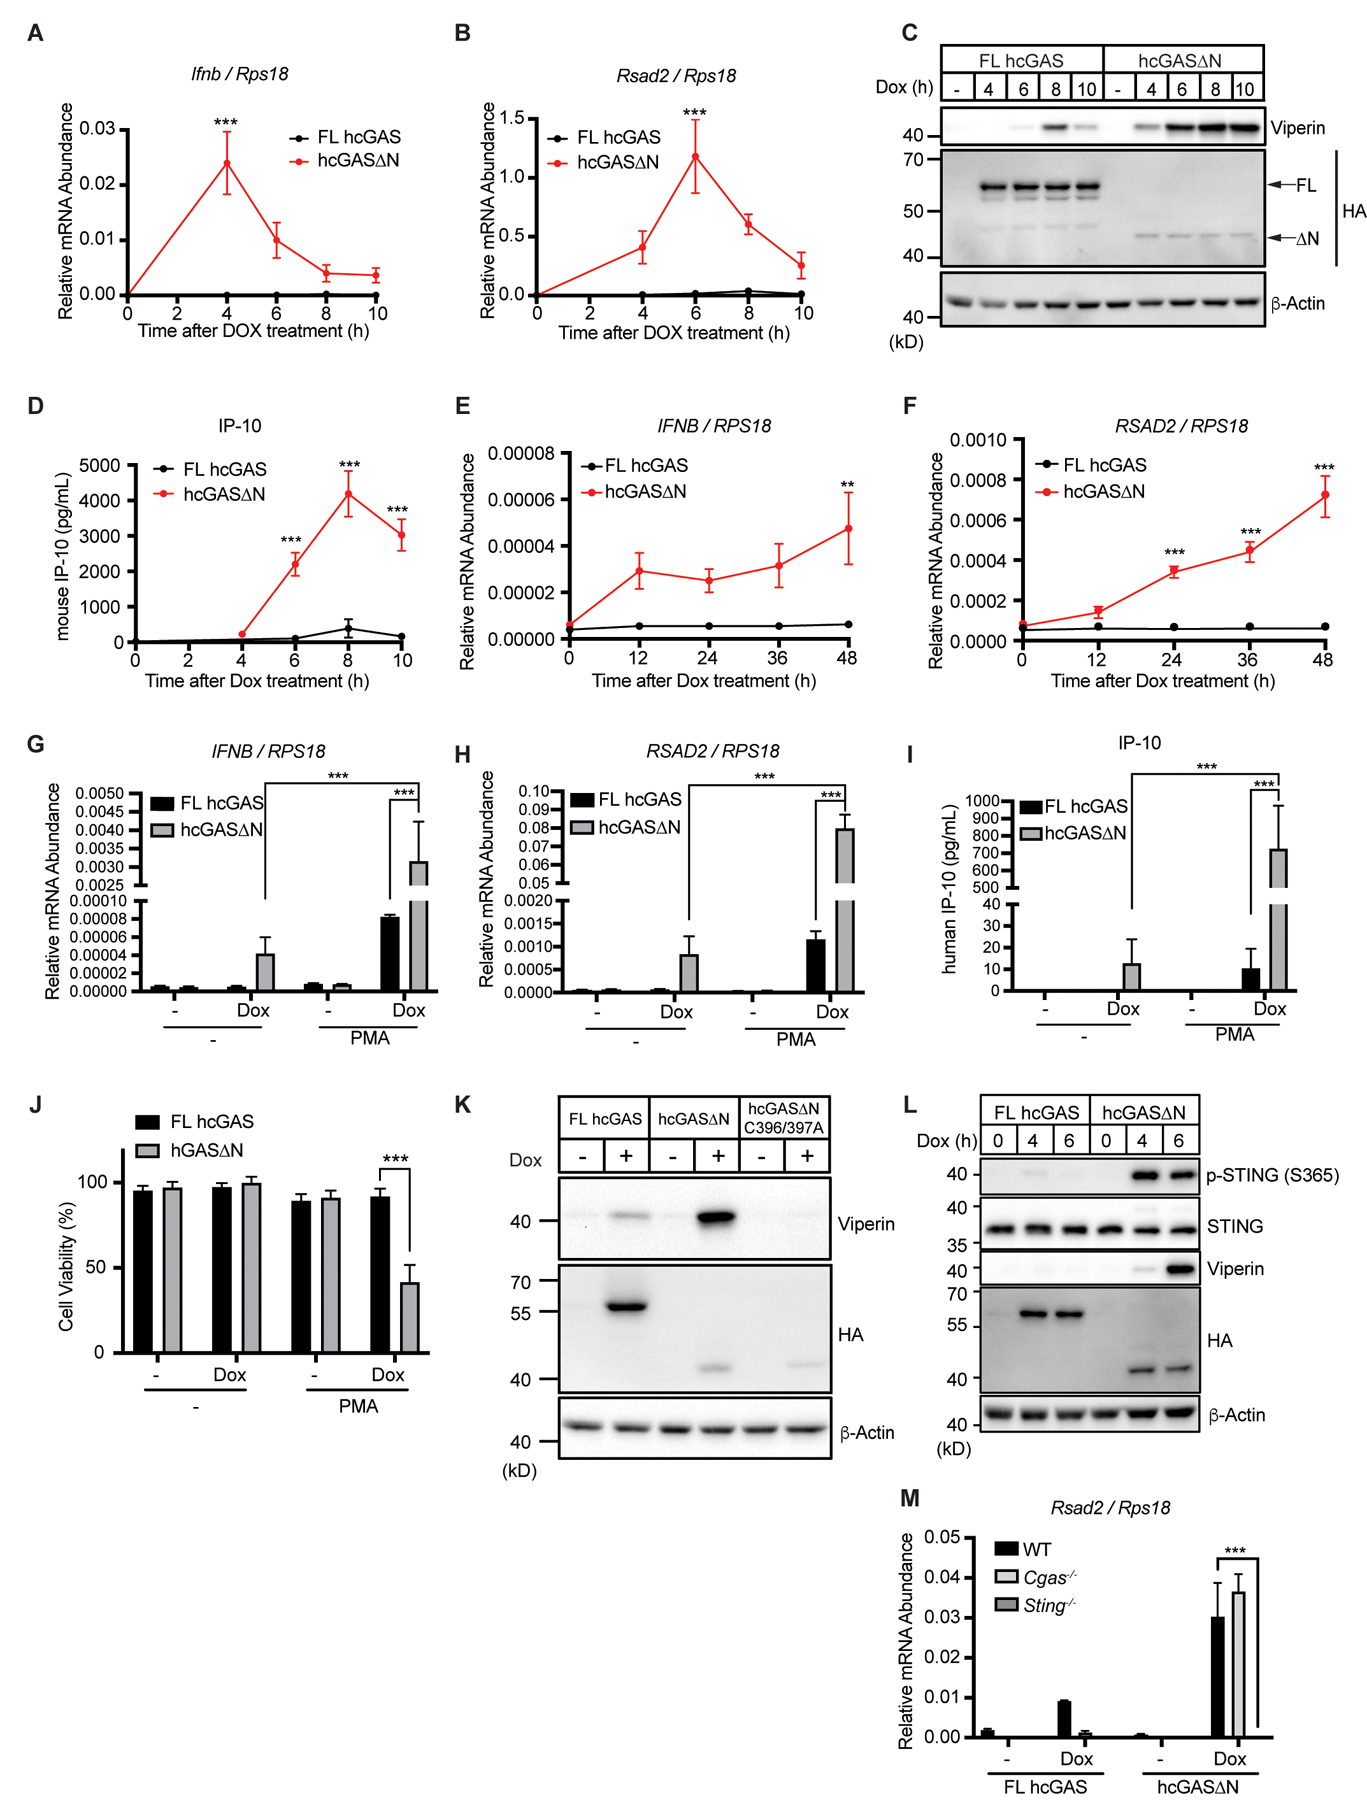
Fig. 1. Human cGAS∆N induces aberrant type I IFN responses.

(A and B) Real-time quantitative reverse transcription (qRT-) PCR analysis of Ifnb (A) and Rsad2 (B) mRNAs in iBMDMs. Cells were treated with Dox, and mRNA expression levels were analyzed at the indicated time points. (C) Immunoblot analysis of iBMDM lysates after the same treatment as in (A) and (B). Arrows in the HA panel indicate FL human cGAS and human cGAS∆N. (D) IP-10 ELISA of supernatant of the cells in (A) and (B). (E and F) qRT-PCR analysis of IFNB (E) and RSAD2 (F) mRNAs in THP-1 monocytes treated with Dox for indicated time points. (G and H) Real-Time qRT-PCR analysis of IFNB and RSAD2 mRNAs in THP-1 monocytes treated with Dox together with PMA for 48 hours. (I) IP-10 ELISA analysis of THP-1 supernatant in (G and H). (J) Viability analysis of THP-1 cells treated as in (G) and (H). (K) Immunoblot analysis of lysates from iBMDMs treated with Dox for 8 hours. (L) Immunoblot analysis of STING phosphorylation in lysates from iBMDMs treated with Dox for indicated time points. (M) qRT-PCR analysis of Rsad2 mRNA in WT, Cgas−/−, or Sting−/− iBMDMs treated with Dox for 8 hours. Immunoblot data are the representative from three independent experiments. Graph data are means ± SEM of three (A, B, D, G, H, I, J, and M) or four (E and F) independent experiments. Statistical significance was determined by two-way ANOVA and Tukey’s multiple comparison test. Asterisks indicate the statistical significance between FL hcGAS and hcGAS∆N at each time point (A, B, D, E, and F) or connected two bars (G, H, I, J, and M). *P < 0.05; **P < 0.01; ***P < 0.001.
