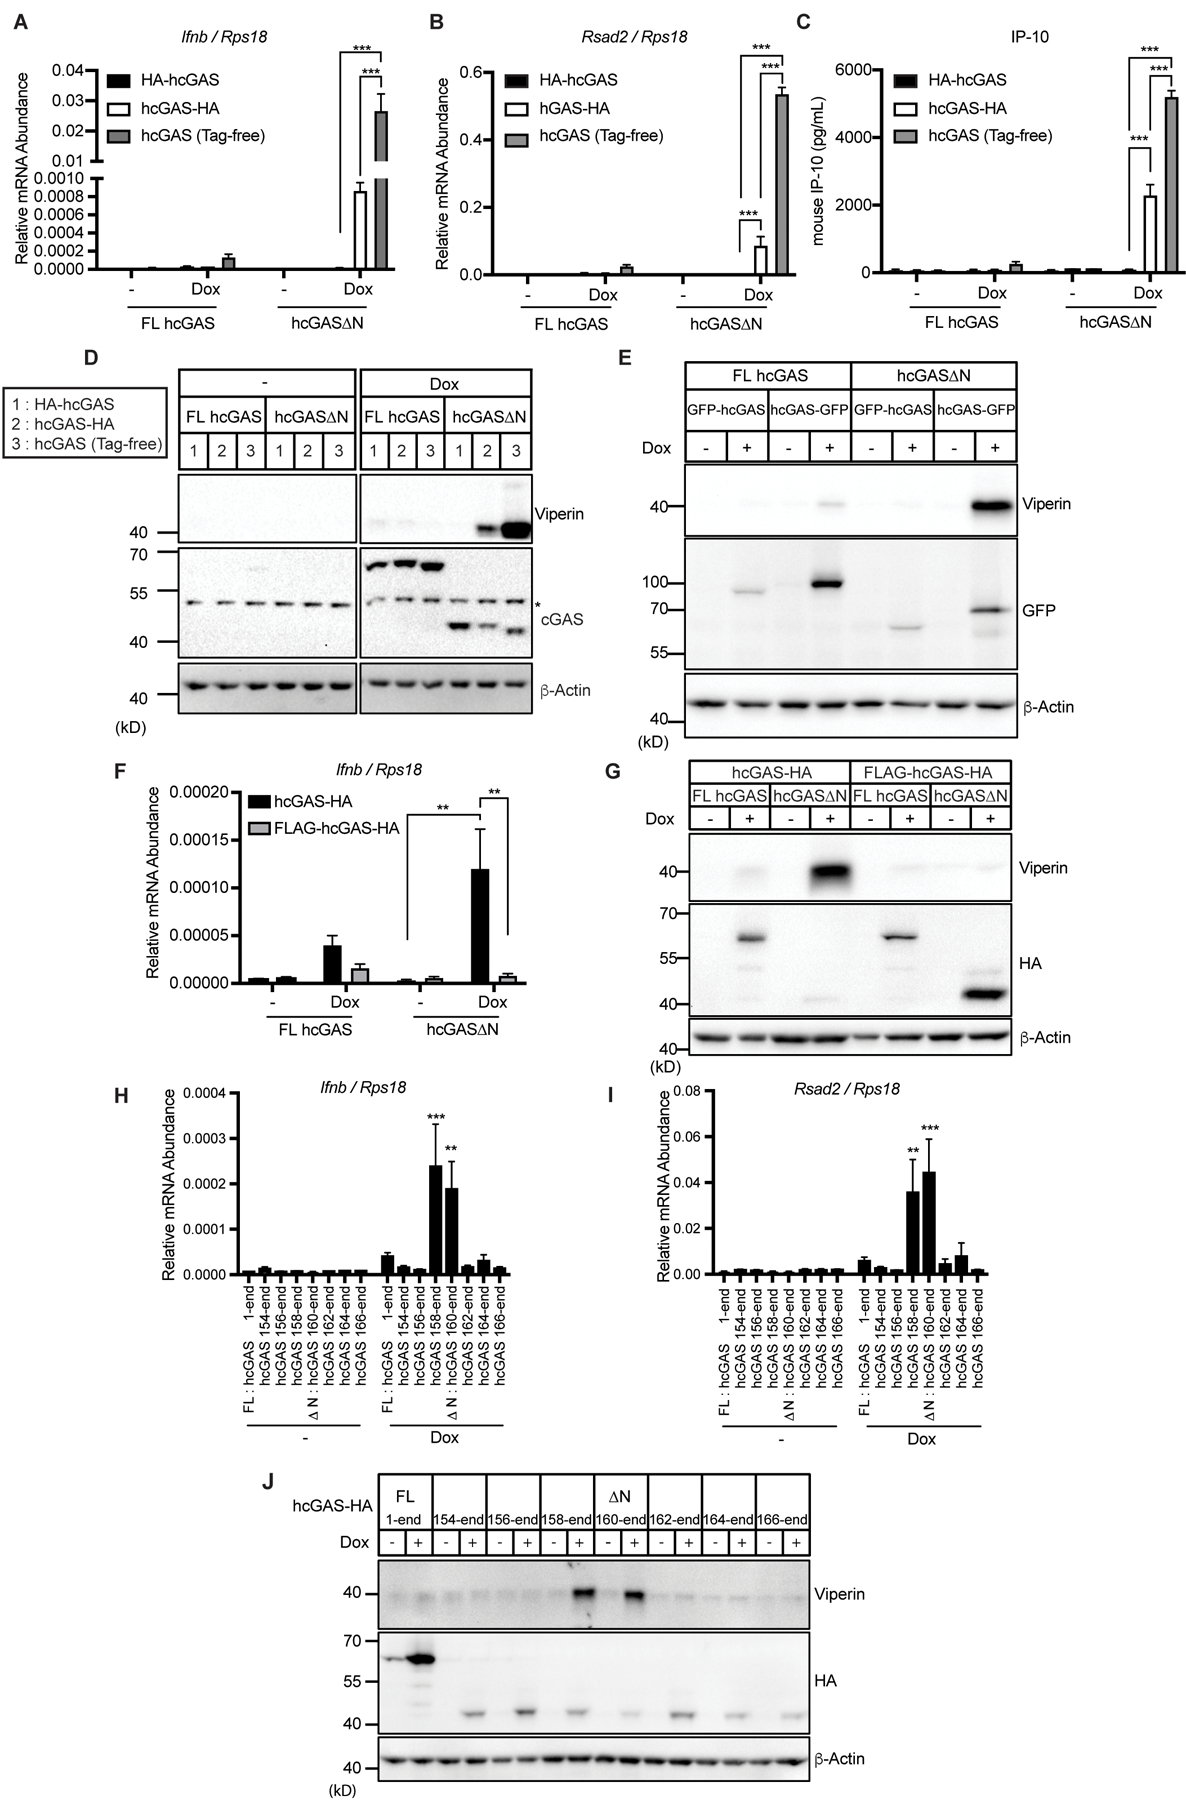
Fig. 2. Specific amino acids at the N-terminus of hcGAS ∆N determines self-DNA reactivity.

(A and B) qRT-PCR analysis of Ifnb (A) and Rsad2 (B) mRNAs in iBMDMs treated with Dox for 8 hours. (C) IP-10 ELISA analysis of iBMDM cell culture supernatant in (A) and (B). (D) Immunoblot analysis of iBMDMs treated with Dox as in (A) and (B). The asterisk indicates non-specific bands. (E) Immunoblot analysis of iBMDMs treated with Dox for 8 hours. (F) qRT-PCR analysis of Ifnb mRNAs in iBMDMs treated with Dox for 8 hours. (G) Immunoblot analysis of iBMDMs treated with Dox as in (F). (H and I) qRT-PCR analysis of Ifnb (H) and Rsad2 (I) mRNAs in iBMDMs treated with Dox for 8 hours. (J) Immunoblot analysis of lysates of iBMDMs treated as in (H) and (I). Immunoblot data are the representative from three independent experiments. Graph data are means ± SEM of three (A, B, and F) or five (C, H, and I) independent experiments. Statistical significance was determined by two-way ANOVA and Tukey’s multiple comparison test. Asterisks indicate the statistical significance between connected two bars (A, B, C, and F) or between untreated and Dox-treated conditions for indicated hcGAS mutants (H and I). *P < 0.05; **P < 0.01; ***P < 0.001.
