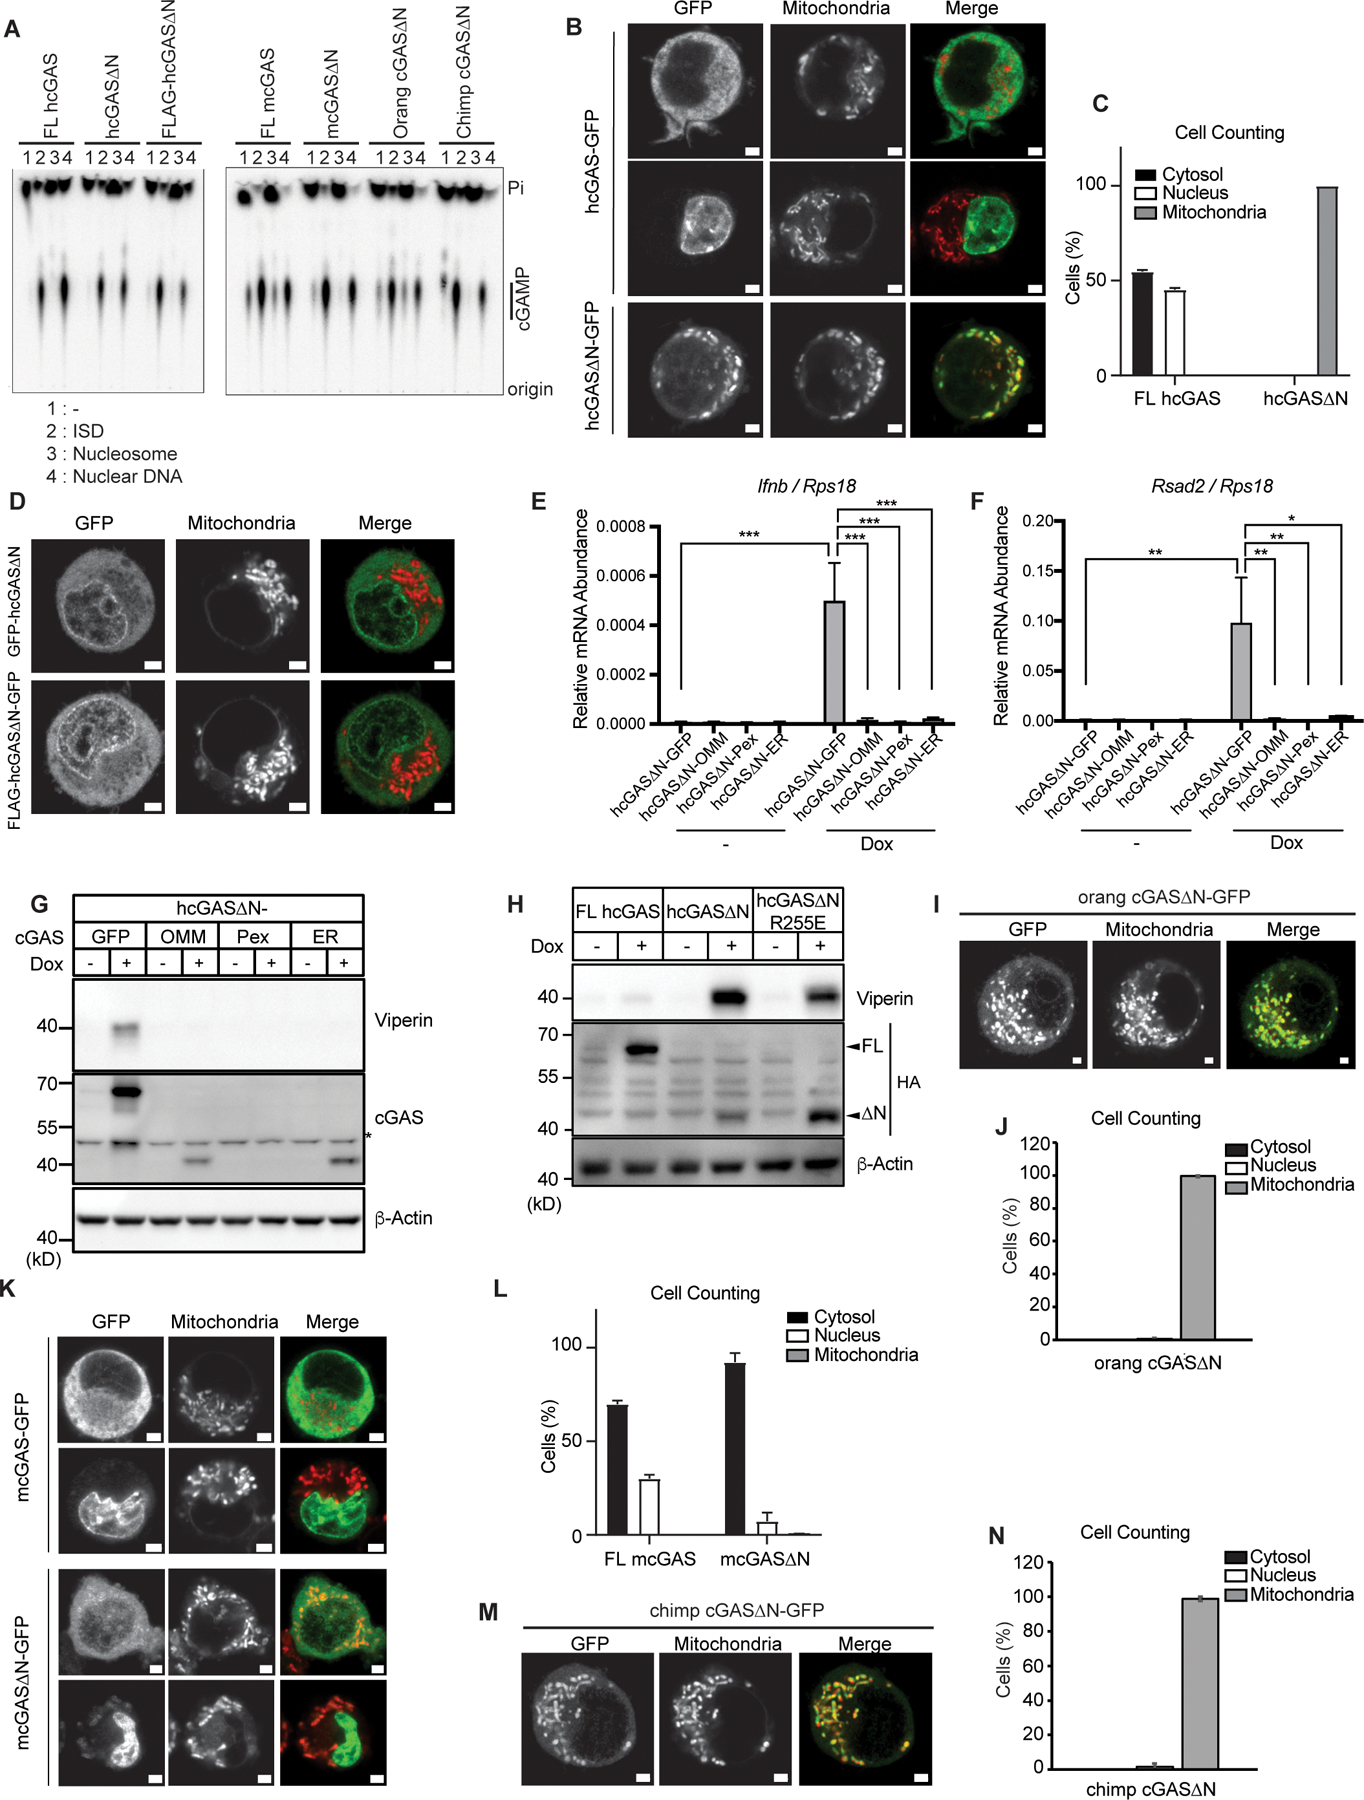
Fig. 4. Mitochondrial localization and signaling activities of cGAS.

(A) cGAS production of cGAMP in vitro with purified components consisting of 45 bp interferon stimulatory DNA (ISD), nucleosomal DNA, or nuclear dsDNA. Recombinant cGAS proteins included FL hcGAS, hcGAS∆N (160–522 a.a.), FLAG-hcGAS∆N, FL mcGAS, mcGAS∆N (148–507 a.a.), orangutan (orang) cGAS∆N, and chimpanzee (chimp) cGAS∆N. (B) Live confocal micrographs of C-terminally GFP-tagged human FL cGAS or cGAS∆N. (C) Cell counting in (B). Cells with nuclear, cytosolic, and mitochondrial cGAS localization were counted and the ratio was calculated. (D) Live confocal micrographs of human cGAS∆N with indicated tags. Representative cell images are shown. (E and F) qRT-PCR analysis of Ifnb (E) and Rsad2 (F) mRNAs in iBMDMs treated with Dox for 8 hours. OMM: outer mitochondrial membrane; Pex: peroxisomes; ER: endoplasmic reticulum. (G) Immunoblot analysis of iBMDM lysates treated as in (E) and (F). The asterisk indicates non-specific bands. (H) Immunoblot analysis of iBMDM lysates treated with Dox for 8 hours. (I) Live confocal micrographs of C-terminally GFP-tagged orangutan (orang) FL cGAS or cGAS∆N. Representative cell images are shown. (J) Cell counting in (I). (K) Live confocal micrographs of C-terminally GFP-tagged mouse FL cGAS or cGAS∆N. Representative cell images are shown. (L) Cell counting in (K). Cells with nuclear, cytosolic, and mitochondrial cGAS localization were counted and the percentages of each localization pattern were calculated. (M) Live confocal micrographs of C-terminally GFP-tagged chimpanzee (chimp) FL cGAS or cGAS∆N. Representative cell images are shown. (N) Cell counting in (M). Scale bars in all the images indicate 2 µm. Green signals indicate GFP, and red signals indicate mitochondria in all the merged images. Images and immunoblot data are representative from three independent experiments. Graph data are means ± SEM of three independent experiments. Statistical significance was determined by two-way ANOVA and Tukey’s multiple comparison test. Asterisks indicate the statistical significance between connected two bars. *P < 0.05; **P < 0.01; ***P < 0.001.
