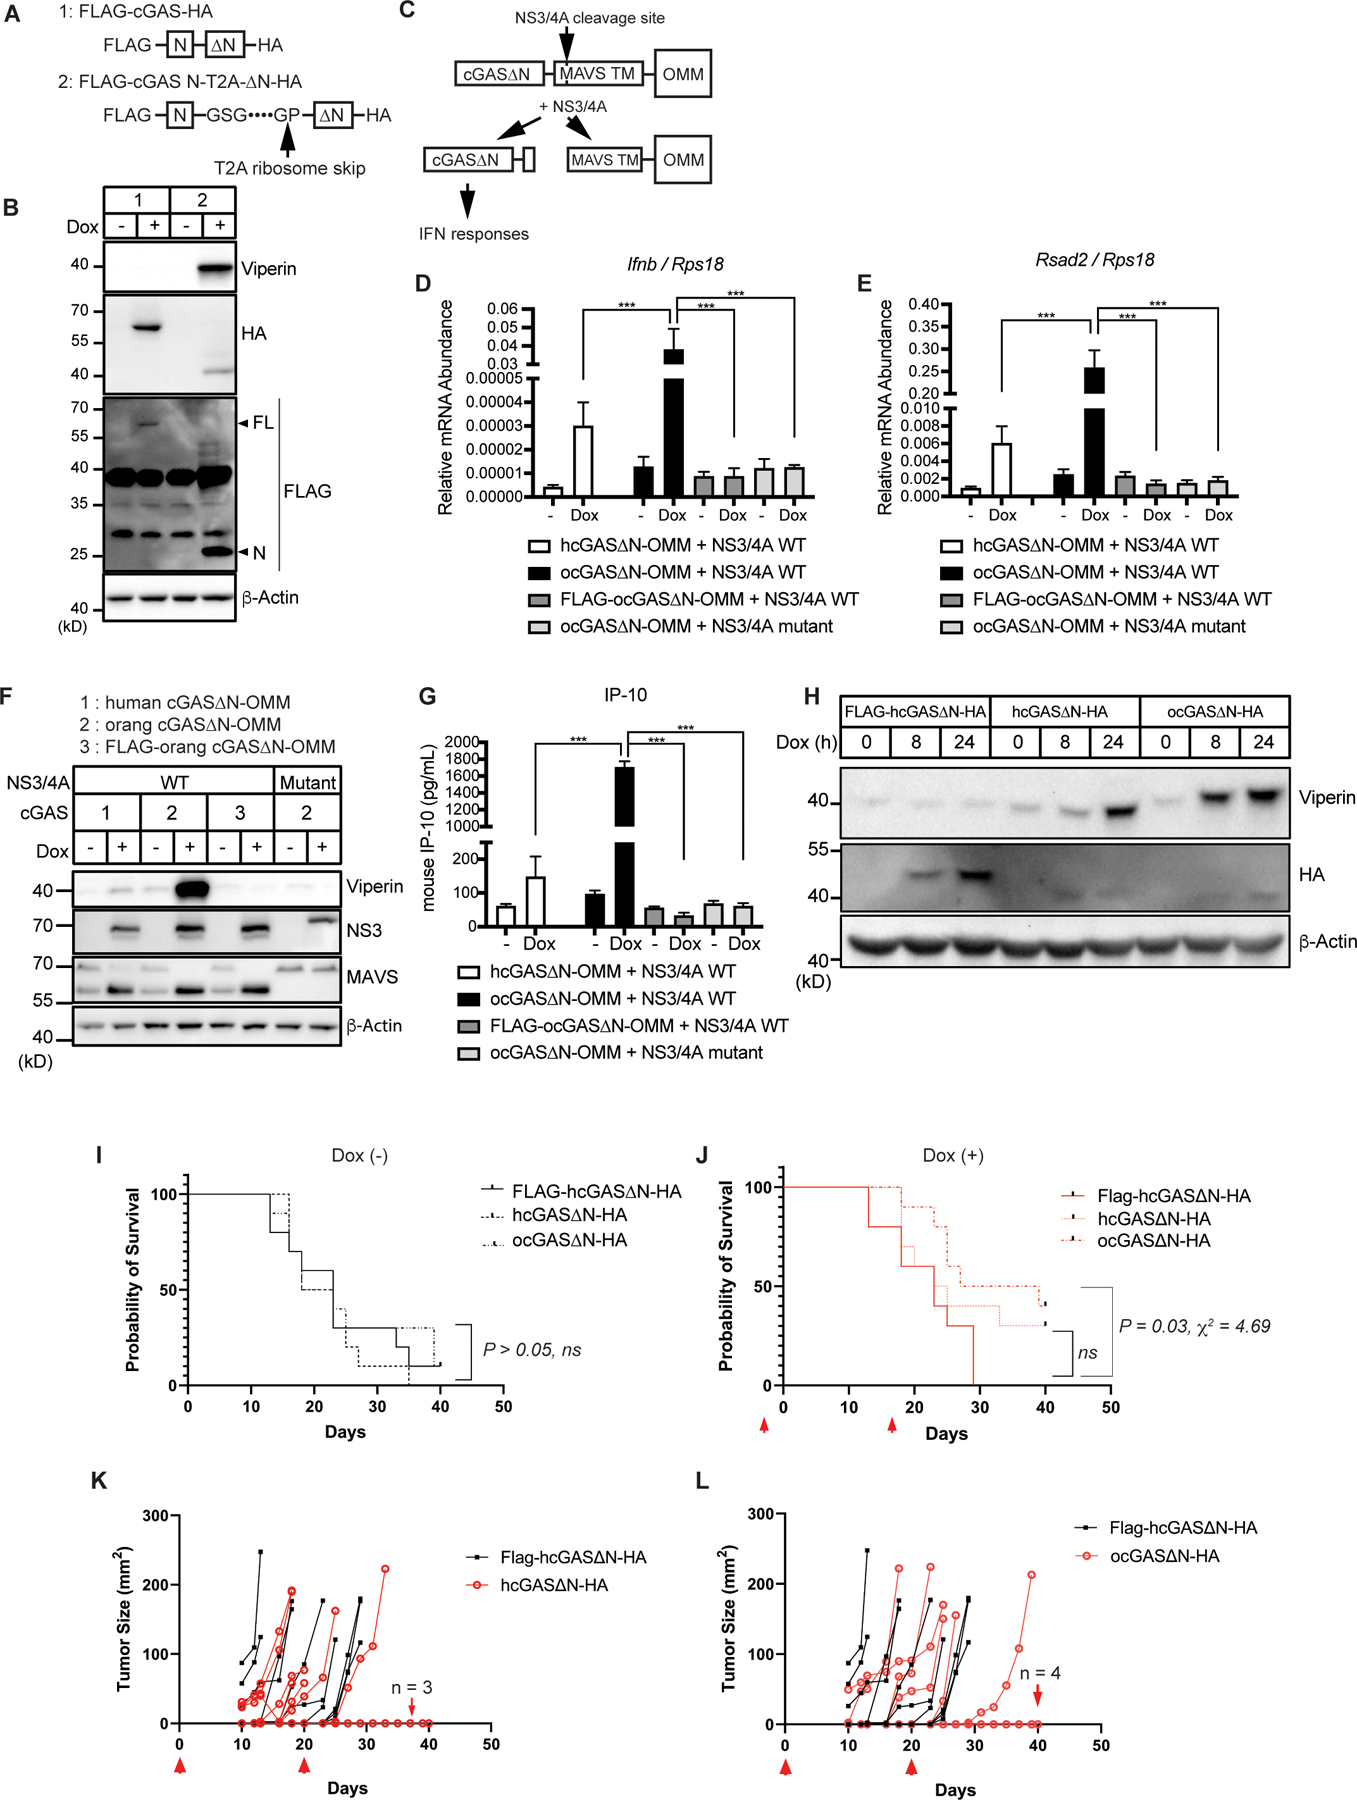
Fig. 5. User-defined cGAS∆N responses to a viral protease and in vivo tumor transplant.

(A) Schematic designs of cGAS constructs with T2A consensus sequences. FLAG-cGAS N-T2A-∆N-HA is separated upon translation at the indicated arrow. (B) Immunoblot analysis of lysates of iBMDMs treated with Dox for 8 hours to induce expression of cGAS alleles shown in (A). (C) Schematic design of cGAS-outer mitochondrial membrane (OMM) construct and the cleavage by NS3/4A protease. (D and E) Real-Time qRT-PCR analysis of Ifnb (D) and Rsad2 (E) mRNAs in cGAS-expressing iBMDMs treated with Dox for 24 hours to induce expression of WT or mutant NS3/4A proteases. Cells stably expressed indicated human cGAS (hcGAS) or orangutan cGAS (ocGAS) constructs. (F) Immunoblot analysis of iBMDMs treated as in (D) and (E). (G) IP-10 ELISA analysis of iBMDM cell culture supernatant in (D) and (E). (H) Immunoblot analysis of lysates from B16OVA treated with Dox for indicated times to induce expression of cGAS∆N constructs. (I and J) Kaplan-Meier survival of mice s.c.-transplanted with B16OVA with indicated transgenes without (I) or with (J) Dox administration. Red arrows in (J) indicate the timing of three-day administration of Dox in their drinking water. n = 10 mice per group. (K and L) Tumor area in the mice s.c.-transplanted with B16OVA and administered with Dox in the drinking water. Comparison between mice with FLAG-hcGAS∆N-expressing tumors and hcGAS∆N-expressing tumors (K) and mice with FLAG-hcGAS∆N-expressing tumors and orangutan cGAS∆N-expressing tumors (L) are shown. Red arrows indicate the timing of three-day administration of Dox in their drinking water. The number of mice that did not develop tumors are indicated in each graph. n = 10 mice per group. Immunoblot data are representative from three independent experiments. Graph data (D, E, and G) are means ± SEM of three independent experiments. In vivo experiments (K to L) were performed once. Statistical significance was determined by two-way ANOVA and Tukey’s multiple comparisons test (D, E, and G) or calculated by the Gehan-Breslow-Wilcoxon method following Kaplan-Meier analysis (I and J). Asterisks indicate the statistical significance between connected two bars. *P < 0.05; **P < 0.01; ***P < 0.001. ns: non-significant.
