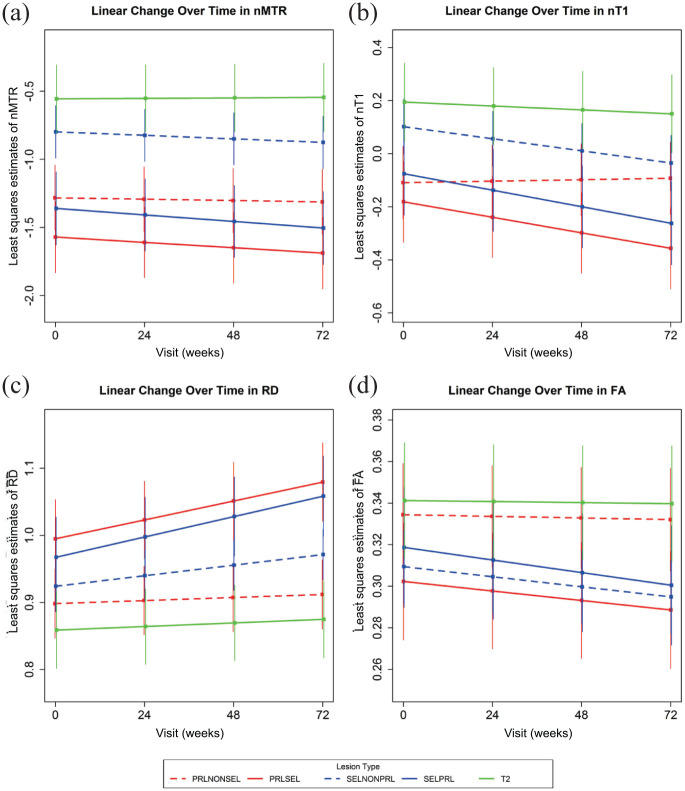
Figure 2.
Evolution of tissue damage in PRLs and SELs based on lesion-level correspondence. PRLs are subcategorized into those that overlap with SELs (PRL+/SEL+, solid red line) and those that do not (PRL+/SEL−, dashed red line). SELs are subcategorized into those that overlap with PRLs (SEL+/PRL+, solid blue line) and those that do not (SEL+/PRL−, dashed blue line). Overall T2 lesions are included as a reference (solid green line). Least-squares estimates and [95%] confidence intervals of change over time are derived from MMRM with weeks since baseline modeled as linear continuous. (A) nMTR, (B) nT1, (C) RD, and (D) FA.
FA: fractional anisotropy; MMRM: mixed-effect model of repeated measurement; nMTR: normalized magnetization transfer ratio; nT1: normalized T1 intensity; PRL: paramagnetic rim lesion; RD: radial diffusivity; SEL: slowly expanding lesion.

