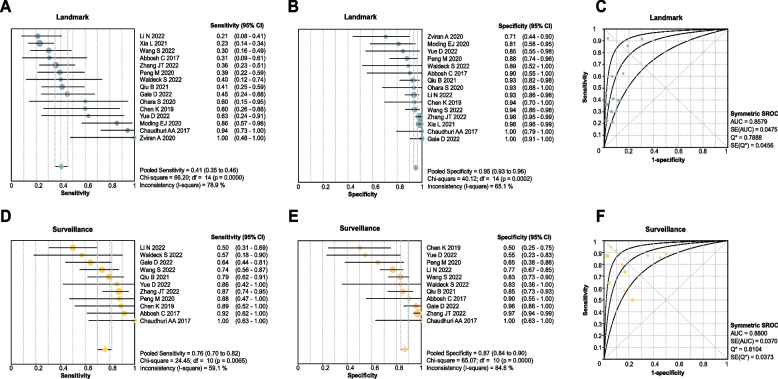
Fig. 2.
Performance of ctDNA analysis approaches for detecting MRD in non-small cell lung cancer. Size of dots is a visual representation for the weight of that study in the meta-analysis. Error bars, the 95% confidence intervals. A Summary of clinical sensitivity for ctDNA detection at the first posttreatment time point (ctDNA MRD landmark). Clinical sensitivity is defined as the percentage of patients who relapsed in the follow-up period and who were ctDNA positive at the landmark. B Summary of clinical specificity for ctDNA detection at the first posttreatment time point. Clinical specificity is defined as the percentage of patients who did not relapse in the follow-up period who were ctDNA negative at the landmark. C Summary receiver operating characteristic (SROC) curve of ctDNA detection at the first posttreatment time point. D Summary of clinical sensitivity for ctDNA detection with longitudinal monitoring posttreatment (ctDNA Surveillance). E Summary of clinical specificity for ctDNA detection with longitudinal monitoring posttreatment. F SROC curve of ctDNA detection with longitudinal monitoring posttreatment

