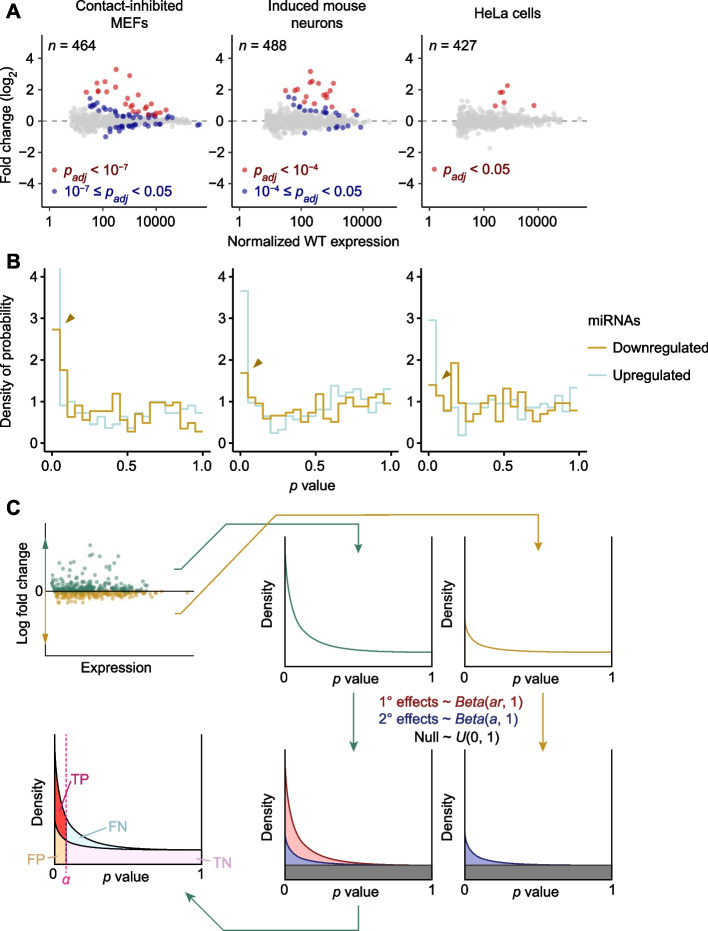
Fig. 1.
Statistical modeling of secondary effects in DE datasets. A Representative plots of fold changes in miRNA levels observed upon ZSWIM8 knockout, as measured by small-RNA sequencing. Points for miRNAs with significant upregulation based on the cutoffs defined by Shi et al. [10] are colored in red. Points for miRNAs that did not meet the adjusted cutoffs but would be significant based on a common cutoff of 0.05 are colored in blue. The number of miRNAs and passenger strands quantified in each dataset is indicated. B Histograms of raw p values for upregulated and downregulated miRNAs and passenger strands analyzed in datasets of A. The peak near p = 0, which indicates true signal above null, is indicated by an orange caret for downregulated miRNAs in each dataset. C BBUM modeling of p values from DE datasets. p values corresponding to upregulated and downregulated miRNAs are fit in parallel to the BBUM model in which downregulated points are fit to a distribution missing the beta component for primary effects. Based on the fitted model, expected FDR and other statistics can be calculated for any cutoff α (TP True positives; FN False negatives; FP False positives; TN True negatives)

