Fig. 5.
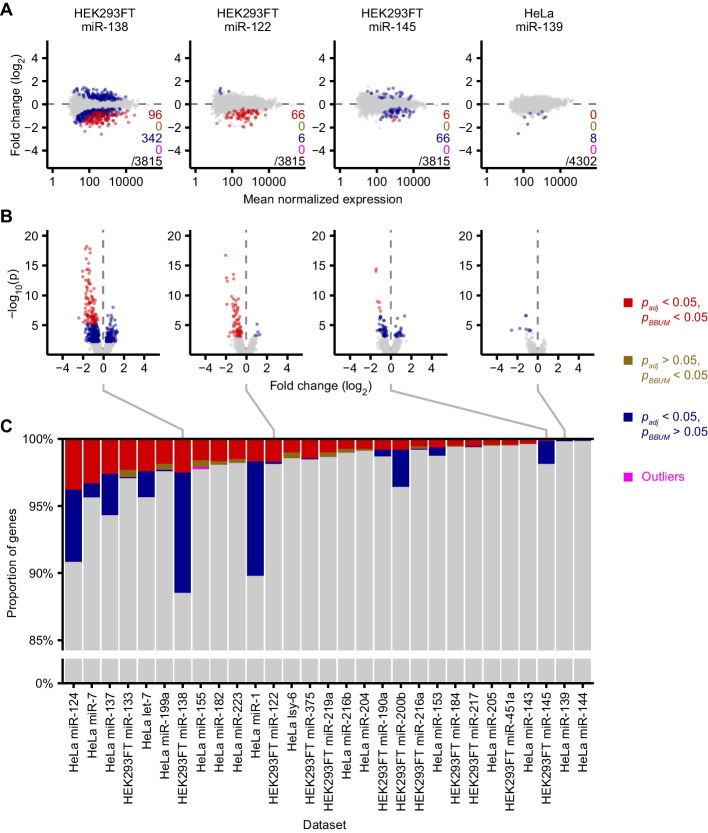
Application of the BBUM correction method to RNA-seq datasets measuring the effects of transfecting a miRNA into either HeLa or HEK293FT cells. A Plots of log2 fold changes in mRNA levels observed upon transfection of the indicated miRNA duplexes. Four representative datasets out of a total of 29 are shown (Additional file 1: Fig. S1). Points for mRNAs that met both the significance cutoff by the BBUM method and the default Benjamini–Hochberg method (padj) are colored red. Those that met the cutoff for the BBUM method but not padj are colored brown. Those that met the cutoff for padj but not the BBUM method are colored blue; these points roughly correspond to genes subject to significant secondary effects. Outliers identified by the BBUM model are colored in magenta. Number of points belonging to each category and the total number of points plotted are indicated for each plot. B Volcano plots of raw p values as a function of mRNA log2 fold change for the same datasets analyzed in A. Colors and order are as in A. Red data points falling beyond the plotted range are omitted. C Proportions of mRNAs in each category for each of the 29 datasets analyzed (Additional file 1: Fig. S1). Colors are as in A and B. Datasets are arranged in descending order of the number of data points called as significant after BBUM FDR adjustment. Bars corresponding to the four representative datasets shown in A and B are indicated

