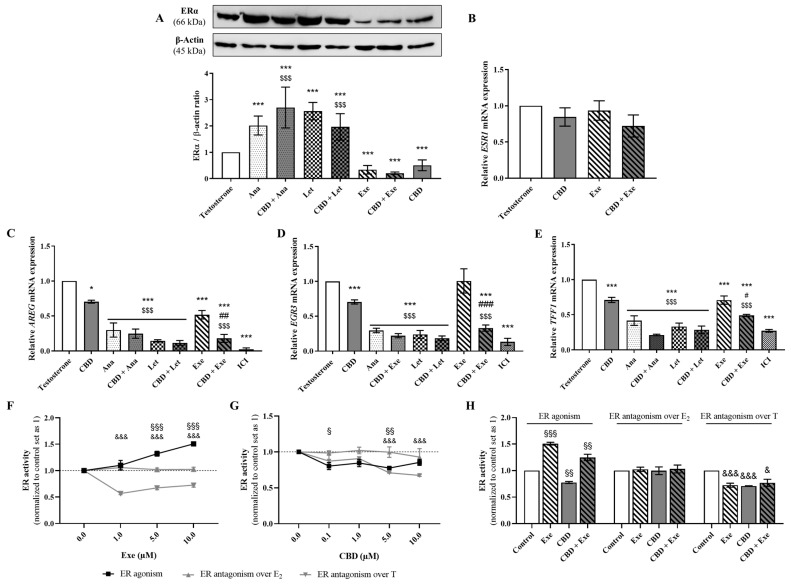
Figure 4.
Involvement of ERα in the effects induced by the AIs, Ana, Let, and Exe, as well as of CBD and their combinations on breast cancer cells. MCF-7aro cells were stimulated with T (1 nM) and treated with the AIs (10 µM), CBD (5 µM) or their combinations for 3 days. Cells treated only with T were used as control. (A) A representative Western blot of ERα and β-actin, as well as the densitometric analysis of ERα expression levels after normalization with β-actin levels, used as loading control, are presented. (B–E) mRNA transcript levels for ESR1 (B), AREG (C), EGR3 (D), and TFF1 (E) genes in relation to the housekeeping gene β-actin. (F–H) ER transactivation assay was performed in VM7Luc4E2 cells treated with Exe (0.1–10 µM; (F), CBD (0.1–10 µM; (G) and their combination (H) in the presence or absence of T (1 nM) or E2 (91.8 pM) over 24 h. Statistically significant differences between MCF-7aro cells treated with compounds and control (T) are expressed as * (p < 0.05) and *** (p < 0.001), while differences between the combinations and each AI alone are represented as # (p < 0.05), ## (p < 0.01) and ### (p < 0.001), and the differences between the combinations and CBD as $$$ (p < 0.001). For transactivation assays, the statistically significant differences between the control and cells treated with compounds but without T or E2 are expressed as § (p < 0.05), §§ (p < 0.01) and §§§ (p < 0.001), while differences between the control and cells treated with compounds in the presence of T are denoted by & (p < 0.05) and &&& (p < 0.001). The original Western blots are represented in Supplementary Figure S1B.

