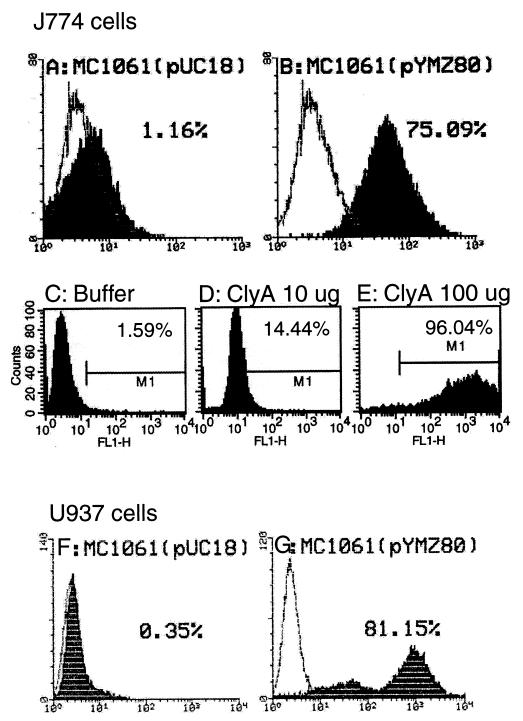
FIG. 4.
Quantitative TUNEL-FACS measurements of apoptosis of infected (MOI of 100) J774 (A and B) and U937 (F and G) macrophages at 12 h (data from one of two repeated tests which gave similar results) or ClyA-treated J774 cells at 36 h (C to E), using FACScan LYSIS II or CellQuest. The quantified percentages of apoptosis are shown. The y axis represents the number of cells (10,000); the x axis represents fluorescence intensity. Shaded areas are macrophages with TdT and overlaid by cells without TdT. The initial cell number in each well of a six-well plate was about 5 × 10⁶. (A) Vector control strain MC1061/pUC18; (B) ClyA-expressing strain MC1061/pYMZ80; (C) Tris-HCl buffer (20 mM, pH 7.5); (D) ClyA (10 μg); (E) ClyA (100 μg); (F) vector control strain MC1061/pUC18; (G) ClyA-expressing strain MC1061/pYMZ80.

