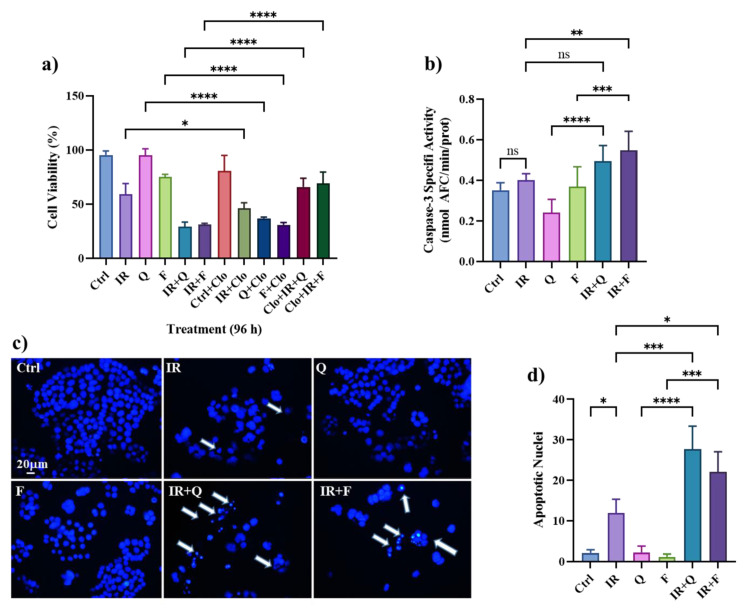
Figure 4.
Different modulation of autophagy and apoptosis by IR, Q, and F in HT500 cells. Panel (a): Crystal violet viability assay in HT500 cells treated as described with or without 10 μM chloroquine (CLO) to discriminate the autophagic role of single and combined treatments. Symbols indicate significant differences: * p < 0.05, ** p < 0.01; *** p < 0.001, **** p < 0.0001 (One-way ANOVA with Bonferroni’s multiple comparisons test was used in these experiments). Panel (b): cells were pre-irradiated (10 Gy) and then treated, respectively, for 72 h with 40 μM Q or 40 μM F or their combination with IR, then Caspase-3 enzymatic activity was measured as described in the Methods section. Symbols indicate significant differences (mean of two experiments in duplicate ± s.d.): n.s. not significant, ** p < 0.01; *** p < 0.001, **** p < 0.0001 (One-way ANOVA). Panels (c,d): cells were pre-irradiated (10 Gy) and then treated, respectively, for 120 h with 40 μM Q or 40 μM F or their combination with IR. Hoechst-stained apoptotic nuclei were photographed (panel (b)) and counted (panel (c)) using fluorescence microscopy (>100 cells/field, 400× magnification; mean of two experiments in duplicate ± s.d.). White arrows indicate apoptotic nuclei. Symbols indicate significant differences: * p < 0.05, ** p < 0.01; *** p < 0.001, **** p < 0.0001 (One-way ANOVA).

