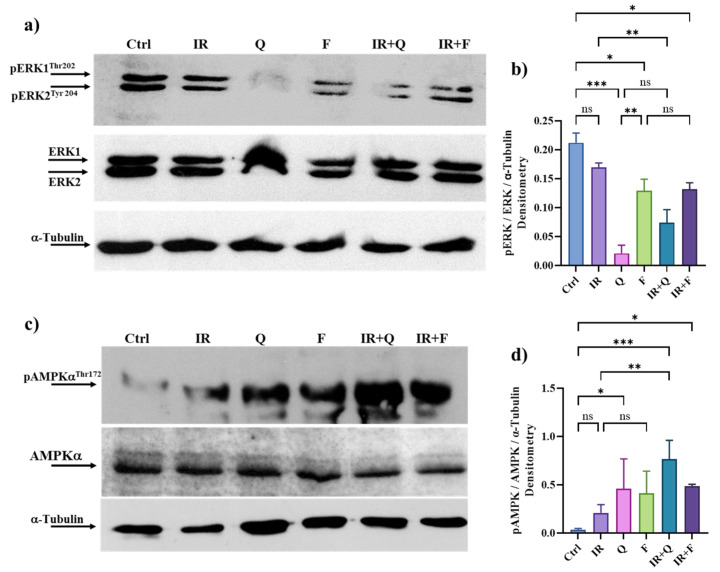
Figure 6.
Western blot analysis of pERK1/2-ERK (panels (a,b)) and pAMPK-AMPK (panels (c,d)). HT500 cells were irradiated with 10 Gy and then incubated for 20 min with Q, F or the combined treatments. Band intensities were quantified by measuring optical density on Gel Doc 2000 and analyzed by Multi-Analyst Software; values in the graphs indicate protein expression normalized with respect to α-Tubulin (mean of two experiments ± s.d.). Symbols indicate significant differences: * p < 0.05, ** p < 0.01; *** p < 0.001, n.s. not significant (one-way ANOVA). The uncropped blots and molecular weight markers are available in the Supporting Information File.

