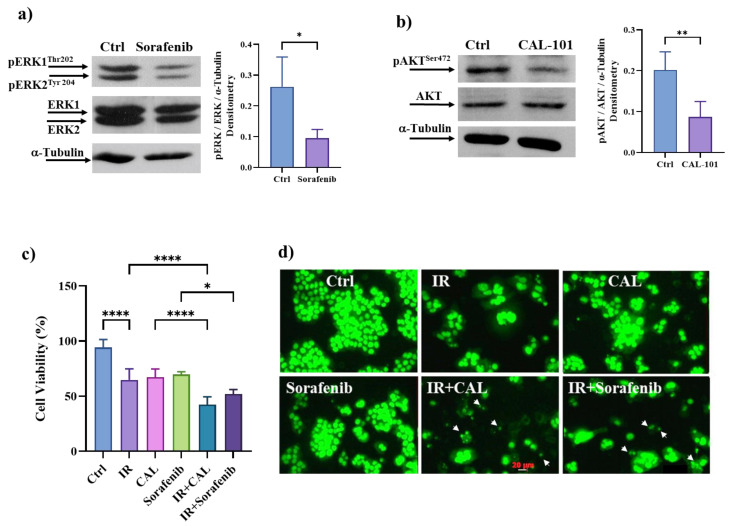
Figure 8.
Panels (a,b): Western blot analysis of pERK1/2-ERK and pAKT-AKT. Cells were incubated for 20 min with Sorafenib (20 μM). or CAL-101 (10 μM). Band intensities were quantified by measuring optical density on Gel Doc 2000 and analyzed by Multi-Analyst Software; values in the graphs indicate protein expression normalized with respect to α-Tubulin (±s.d.) Symbols indicate significant differences: * p < 0.05, ** p < 0.01 Ctrl vs. Sorafenib or CAL-101, respectively (Student’s t-test). Panel (c): Cy-Quant cell viability assay in HT500 cells treated as reported. In the combined treatments, cells were pre-irradiated (10 Gy), then incubated with Sorafenib (20 μM) or CAL-101 (10 μM) for 72 h (mean of two experiments in quadruplicate ± s.d.). Symbols indicate significant differences: ** p < 0.01; **** p < 0.0001 (One-way ANOVA). Panel (d): Micrographs of representative fields of cells stained with Cy-Quant fluorescent dye (200× magnification). White arrowheads in panels IR + CAL and IR + Sorafenib indicate apoptotic bodies.

