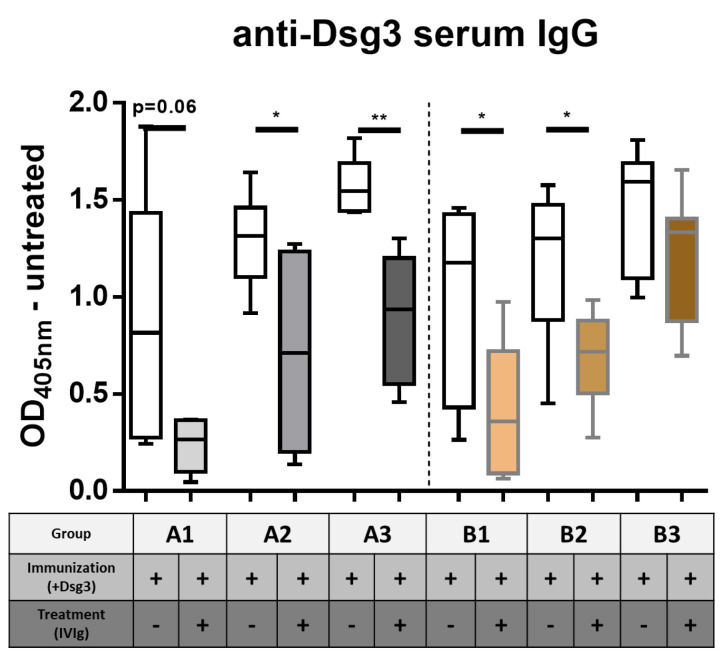
Figure 2.
Serum quantification of Dsg3−specific murine IgG with ELISA. Statistical significance was calculated using the t test with Welch’s correction. p ≤ 0.05 *, p ≤ 0.01 **. Error bars represent standard deviation, mean ± SD. n = 6–8 mice per group, including control PBS groups. A1–3 = prevention protocol, B1–3 = quasi-therapeutic protocol.

