Figure 5.
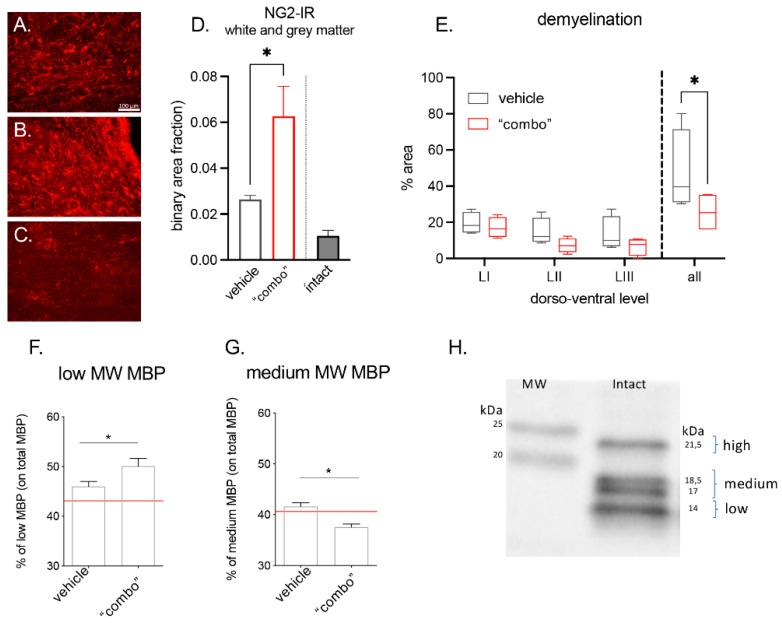
Effect of the 3× “combo” therapy on remyelination markers at long term: (A–C) Representative micrographs of NG2-IR from (A) vehicle, (B) “combo”, and (C) intact groups are shown. Bars: 100 µm; (D) relative binary area fraction of NG2-IR referring to OPCs in grey and white matter, close to the lesion area in the spinal cord; (E) demyelinated area evaluated in Luxol Fast blue stained sections: relative demyelinated area at three different dorsoventral levels (LI, LII, LIII), and the overall ratio (all), in vehicle and “combo”-treated rats; (F–H) graphs showing the % of low and medium isoforms on the total MBP in vehicle and “combo”. The red line represents the intact rat value; (H) representative Western Blot showing the different MBP isoforms. Data are presented as the mean + SEM (immunohistochemistry N = 8 rats/group of treatment, N = 6 intact; WB N = 7 rats/group) or as boxplot (histochemical analysis N = 5 rats/group). Statistical analysis: Student’s t-test; * p < 0.05; p < 0.05 was considered significant. Brightness and contrast of the pictures were adjusted to increase the quality of the image visualization without affecting the qualitative and quantitative analysis which were performed on raw images. Abbreviations: MBP—myelin basic protein; MW—molecular weight; NG2—neural/glial anti-gen 2.

