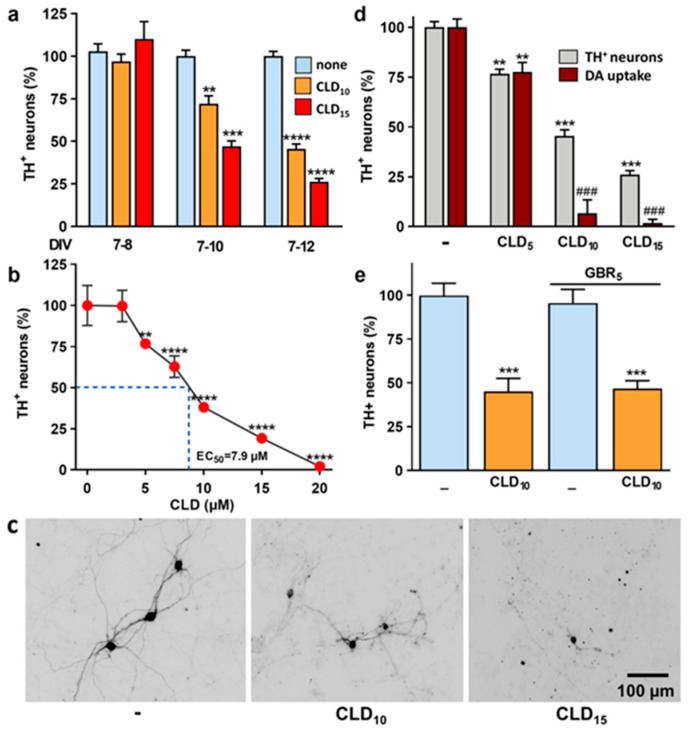
Figure 1.
Characterization of CLD neurotoxic effects on midbrain-cultured DA neurons. (a) Counts of TH+ neurons in midbrain cultures exposed to 10 and 15 µM of CLD for 1, 3 and 5 days. Data are means ± SEMs (n = 6). ** p < 0.01, *** p < 0.001, **** p < 0.0001 vs. untreated corresponding controls. One-way ANOVA followed by Dunnett’s test. (b) Counts of TH+ neurons in midbrain cultures exposed to increasing concentrations of CLD (3–20 µM) for 5 consecutive days. Data are means ± SEMs (n = 6). ** p < 0.01, **** p < 0.0001 vs. untreated controls. One-way ANOVA followed by Dunnett’s test. (c) Illustration of the effects of a 5-day treatment with 10 and 15 µM of CLD on the number of TH+ cells and their morphology. (d) Comparison of the impact of CLD (5, 10, 15 µM) treatment on TH+ cell numbers and DA uptake. Data are means ± SEMs (n = 6). ** p < 0.01, *** p < 0.001 vs. corresponding controls. ### p < 0.001 vs. TH+ cell numbers at the same concentration of CLD. One-way ANOVA followed by SNK test. (e) Impact of the DA uptake inhibitor GBR12909 (5 µM) on TH+ cell numbers in cultures treated or not treated with 10 µM of CLD. Data are means ± SEMs (n = 6). *** p < 0.001 vs. untreated control cultures. One-way ANOVA followed by Dunnett’s test.

