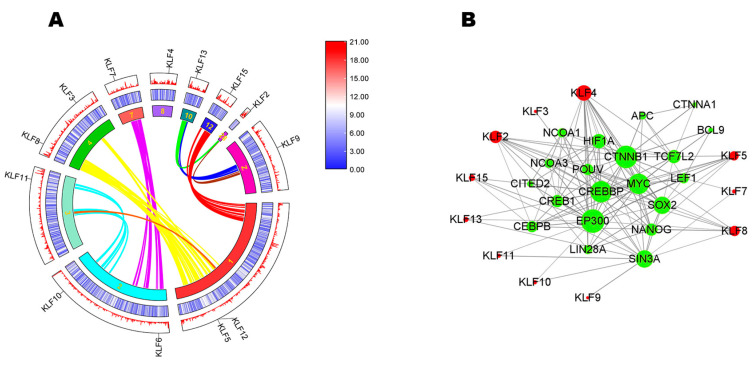
Figure 4.
Synteny analysis and interaction network analysis. (A) The synteny analysis of KLF family in chicken. The innermost circle is composed of 10 chromosomes. The middle and outermost circles show gene density through a heatmap and line. The colors red, white, and blue represent high, medium, and low gene density, respectively. Gene names are shown at different locations of chromosomes. Curves of different colors represent the collinear relationship among different chromosomes and some of the KLFs had collinear relationships with each other. (B) Interaction network analysis. The interaction network shows the interaction relationship among KLFs and other genes.

