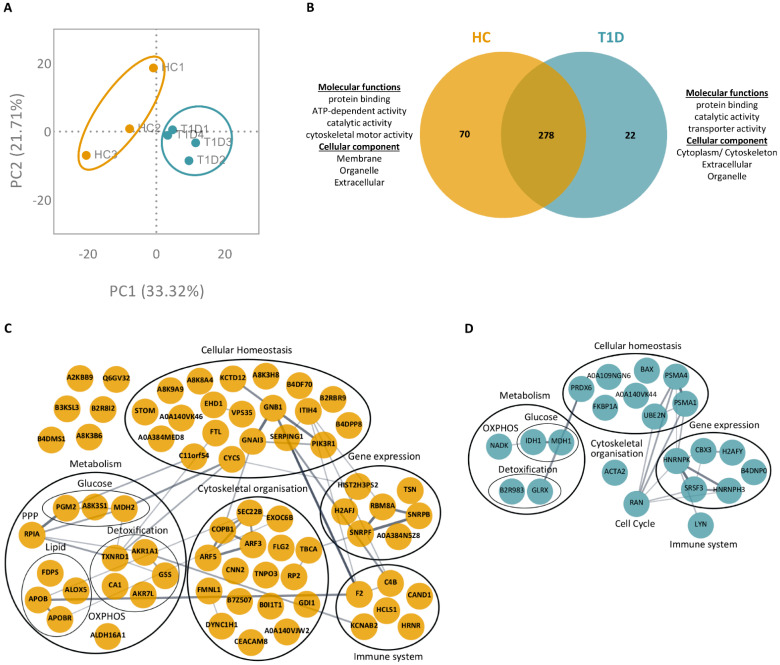
Figure 3.
NET proteome of PMA-stimulated T1D neutrophils is distinct from those of HC. (A) Principal component analysis (PCA) of all proteins identified in the NETomes of HC (yellow, n = 3) and T1D (blue, n = 4) subjects in response to PMA (<1.0% FDR). (B) Venn diagram of overlapping and unique NET proteins in PMA-stimulated HC (left, yellow) and T1D (right, blue) neutrophils. GO annotations of molecular functions and cellular components of proteins exclusive to either HC (left) or T1D (right) NETomes are indicated. (C,D) Protein–protein interaction networks of proteins exclusive to either HC (C) or T1D (D) NETomes, in response to PMA. Proteins are represented by their UniProt gene names. Proteins without assigned UniProt gene names are represented by their unique accession numbers. The thickness of an edge is proportional to the confidence score of the protein–protein interaction. When possible, proteins are clustered and annotated according to the primary biological process in which they are involved (GO).

