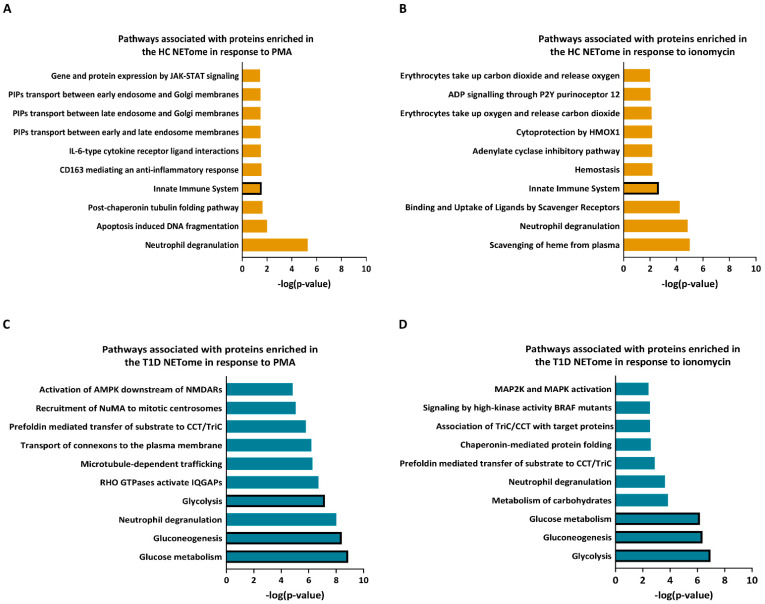
Figure 7.
Pathway analysis of NET proteins enriched in HC and T1D neutrophils in response to PMA and ionomycin. (A,B) Graphs representing top 10 most significant pathways associated with NET proteins with higher expression in neutrophils of HC subjects following PMA (A) and ionomycin (B) stimulation. (C,D) Graphs representing top 10 most significant pathways associated with NET proteins with higher expression in neutrophils of T1D subjects following PMA (C) and ionomycin (D) stimulation (Reactome analysis). The pathways are indicated on the y-axis, and their p-value (−log10)—on the x-axis. Bars representing the relevant pathways are outlined in bold.

