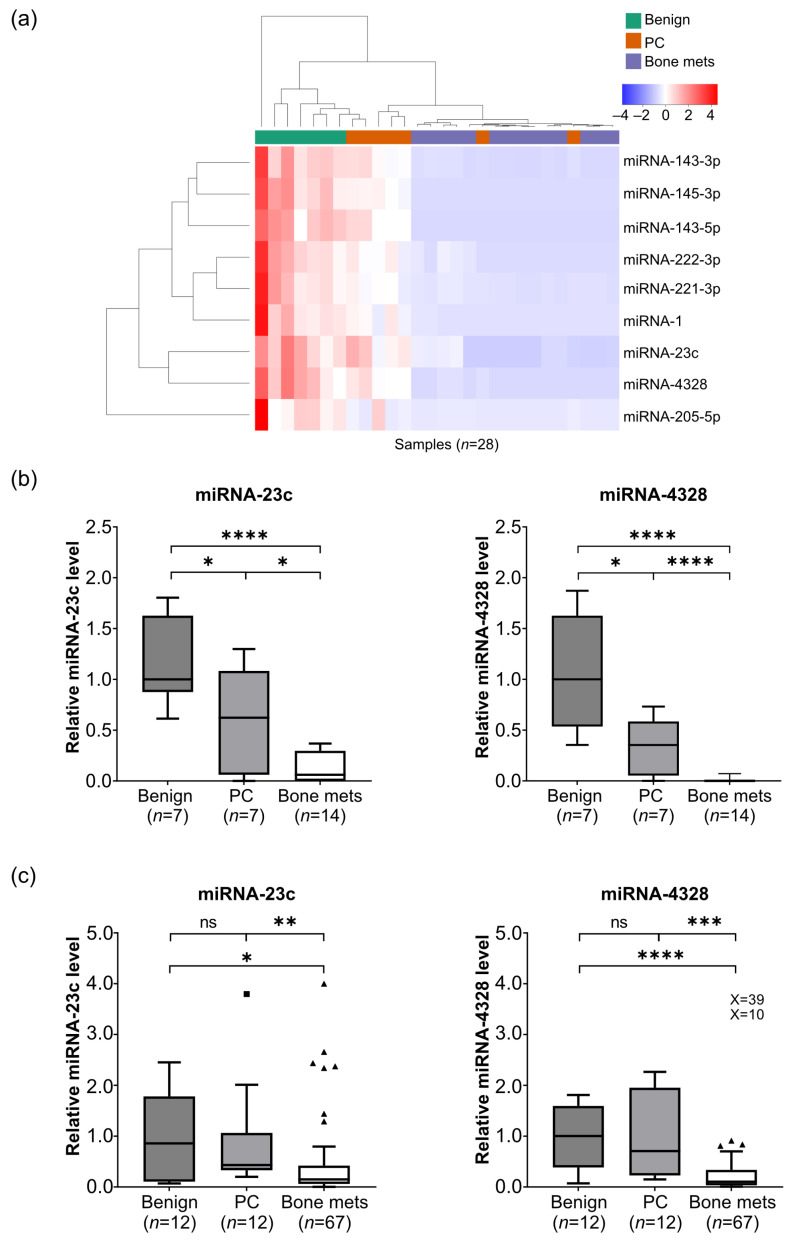
Figure 1.
Reduced miRNA levels during prostate cancer disease progression. (a) Heatmap displaying unsupervised hierarchical clustering of biopsies (n = 28) and miRNAs (n = 9) with significantly reduced tissue levels in localized prostate cancer (PC) (n = 7) as compared to adjacent benign prostate tissue (n = 7), and in castration-resistant prostate cancer bone metastases (bone mets) (n = 14) as compared to localized PC or benign prostate tissue (p < 0.05, differential expression analysis, in R (v4.0.5) limma (v3.46.0) package). (b) Relative levels of miRNA-23c and -4328, respectively, based on normalized fluorescent intensities in microarray analysis (numbers and statistics as indicated in (a)). (c) Relative levels of miRNA-23c and -4328, respectively, based on reverse transcription and quantitative polymerase chain analysis of benign prostate tissue (n = 12), localized PC (n = 12) and bone metastases (n = 67), including hormone-naïve (n = 15), short-term treated (n = 4) and CRPC (n = 48) cases (see Table 1). * p < 0.05, ** p < 0.01, *** p < 0.001, **** p < 0.0001, ns p > 0.05 (Mann–Whitney U-test and Wilcoxon test for paired observations). The square and triangles indicate outliers in the Tukey box plots. X values represent extreme outliers outside the scale.

