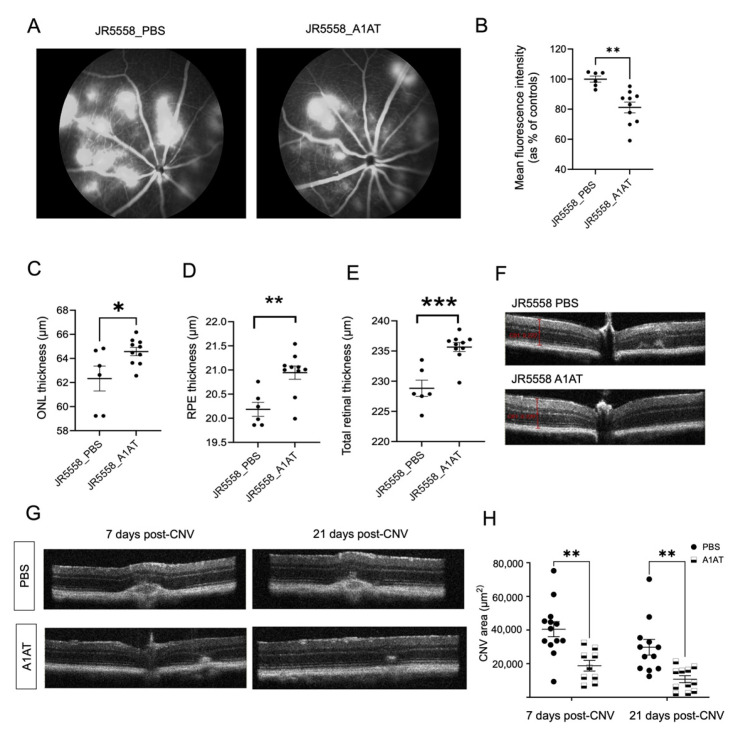
Figure 2.
A1AT ameliorates wet AMD pathology in two mouse models. (A) Fluorescein angiography (FA) images from PBS- and A1AT-injected JR5558 mice. (B) CNV lesion size quantification from FA images. Quantification of ONL (C), RPE (D) and total retinal thickness (E) from the OCT images of PBS and A1AT injected JR5558 mice (n = 6–10 eyes per group). (F) Representative OCT B-scans of PBS injected and A1AT injected JR5558 mice. Representative OCT images (G) showing CNV lesions (post 7 days and 21 days after inducing laser photocoagulation) in PBS- and A1AT-injected laser mice, and the quantification of CNV areas (H) from the OCT images (n = 9–13 eyes per group). Statistics used: t-test for single comparisons, two-way ANOVA, Tukey’s MC for grouped comparisons. * p < 0.05, ** p < 0.01, *** p < 0.001. Data represent the mean ± SEM.

