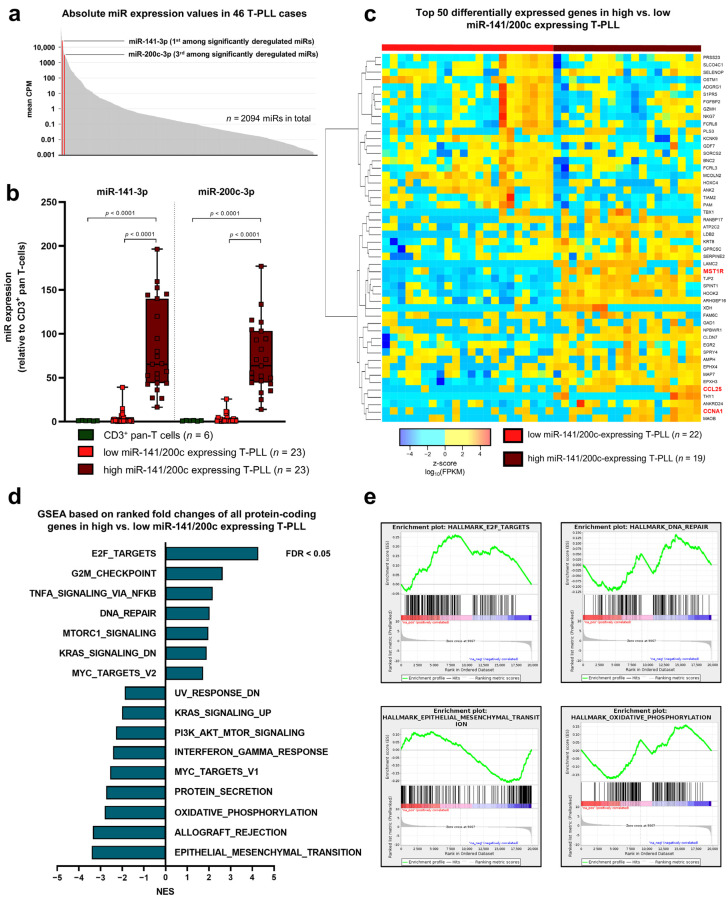
Figure 1.
Upregulation of the miR-141/200c cluster, which is regularly seen in T-PLL cells, is associated with transcriptomes of accelerated cell cycle transition, enhanced survival signaling, and altered DNA damage responses in primary T-PLL. MicroRNA (miR) profiles were evaluated using small RNA sequencing of primary human peripheral blood-derived T-prolymphocytic leukemia (T-PLL) cells (n = 46 cases) and CD3+ healthy donor-derived pan-T-cell controls (n = 6 donors), recapitulating a previously published dataset [19]. In addition, polyA-RNA sequencing was performed on PB-isolated tumor cells from 41 miR-characterized T-PLL patients in order to align miR-141/200c expression data with those of global transcriptome alterations. (a) Bar chart displaying mean CPM values for a total of 2094 miRs detected by small RNA sequencing in at least one T-PLL patient. MiR-141-3p (mean CPM = 26,561) and miR-200c-3p (mean CPM = 3144) were among the miRs with the highest absolute CPM values and are highlighted in red. In total, 34 miRs were significantly deregulated in T-PLL cases compared to healthy donor-derived pan-T cells. (b) Relative expression of miR-141-3p and miR-200c-3p as analyzed by small RNA sequencing (RNA-seq) in primary T-PLL cells (n = 46) and healthy donor-derived CD3+ pan-T cells (dark green, n = 6). MiR-141-3p (fold change (fc) = 43.2; false discovery rate (FDR) = 0.005) and miR-200c (fc = 38.2; FDR = 0.005) are highly overexpressed in T-PLL cells. Notably, half of all sequenced T-PLL cases displayed miR-141/200c expression similar to healthy donor-derived T-cells (‘low miR-141/200c’ T-PLL subset, light red, n = 23 cases; for miR-141-3p: fc = 4.37; p = 0.98; for miR-200c-3p: fc = 3.81, p = 0.97; both one-way ANOVA, compared to healthy controls), and the other half showed marked upregulation of both miR-141-3p and miR-200c-3p (‘high miR-141/200c’ T-PLL subset, dark red, n = 23 cases; for miR-141-3p: fc = 82.08; p < 0.0001; for miR-200c-3p: fc = 72.58, p < 0.0001; both one-way ANOVA, compared to healthy controls). (c) Heatmap of the 50 highest differentially expressed mRNAs, comparing the ‘high miR-141/200c’ T-PLL subset (n = 22) to the ‘low miR-141/200c’ subset (n = 19). The colors represent z-scores of respective Fragments Per Kilobase Million (FPKM) values calculated for each mRNA (red = higher z-score; blue = lower z-score). (d,e) Gene set enrichment analysis (GSEA), based on the complete list of fold changes of all protein-coding genes comparing the ‘high miR-141/200c’ T-PLL subset (n = 22) to the ‘low miR-141/200c’ subset (n = 19). In total, 14 of 50 HALLMARK gene sets displayed significant positive enrichment (FDR < 0.05, Kolmogorov–Smirnov test) in high miR-141/200c-expressing T-PLL cases compared to their low miR-141/200c counterpart, whereas 12 gene sets showed significant negative enrichment in the high miR-141/200c cluster. A selection of HALLMARK pathways, related to cancer, is displayed in (d), and exemplary GSEA plots are presented in (e). Supplementary Table S1 presents patient characteristics of all included T-PLL cases (n = 103). Supplementary Table S2 summarizes differential gene expression and deregulated GSEA pathways between high and low miR-141/200c T-PLL cases.

