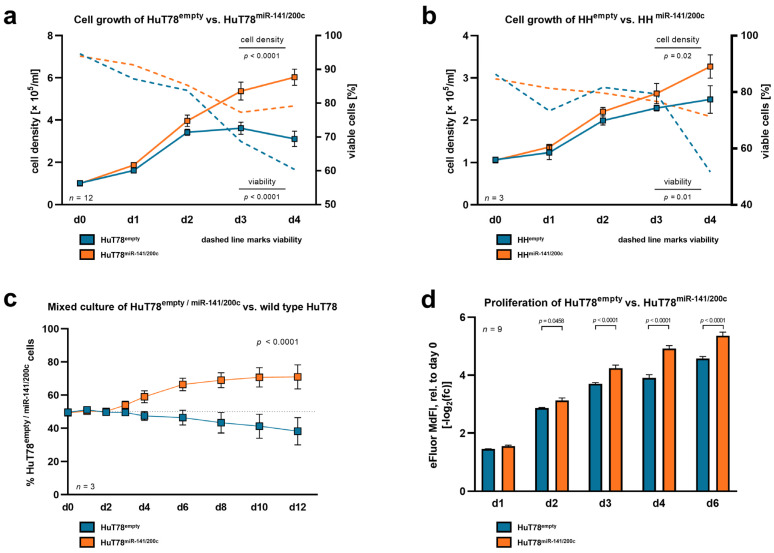
Figure 2.
Overexpression of the miR-141/200c cluster in mature T-cell lymphoma lines leads to accelerated proliferation and diminished cell death under serum starvation. To interrogate whether higher levels of miR-141/200c lead to a more aggressive and proliferative cellular phenotype, we introduced lentiviral vectors with or without the miR-141/200c genomic cluster into the mature CTCL lines HuT78 and HH. (a,b) Cell density and viability as measured by Trypan blue staining of (a) HuT78miR-141/200c and HuT78empty, and (b) HHmiR-141/200c and HHempty. Cells with and without miR-141/200c overexpression were seeded at a low density (1 × 10⁵ cells/mL) and cultured over four days in a culture medium with low serum contents (RPMI + 1% FBS (HuT78) or RPMI + 2% FBS (HH)). On each day, means with standard error of the mean (SEM) are presented. HuT78 and HH cells with high miR-141/200c expression partially overcame the stress induction via serum starvation, whereas the control cells showed stagnation in cell counts and more rapidly decreasing cell viability (HuT78: viability: p < 0.0001, cell density: p < 0.0001; HH: viability: p = 0.01; cell density: p = 0.02; two-way ANOVA). (c) Representative mixed culture of n = 3 independent experiments. HuT78miR-141/200c or HuT78empty cells (GFP-positive cells) were cultured in a 50:50 ratio together with parental, non-transduced HuT78 cells (GFP-negative cells). Cells were seeded in triplicate at a density of 3 × 10⁵/mL in growth medium with low serum contents (RPMI + 1% FBS). Culture medium with 1% FBS was replaced every two days. The GFP ratio was monitored over 12 days via flow cytometry. The light grey line marks the 50:50 ratio. HuT78miR-141/200c outgrew their parental counterpart (d12: 69.88% GFP positivity), while the HuT78empty control cells did not (d12: 40.18% GFP positivity; p < 0.0001, two-way ANOVA). (d) Assessment of cell proliferation in HuT78miR-141/200c and HuT78empty cells. HuT78miR-141/200c and HuT78empty cells were labeled with 5 μM of Invitrogen Cell Proliferation Dye eFluor 670TM (ThermoFisher, Waltham, MA, USA), according to the manufacturer’s instructions. Then, cells were seeded at a low density (1 × 10⁵ cells/mL) and cultured over six days in culture medium with low serum contents (RPMI + 1% FBS). Signal intensity was assessed via flow cytometry. The signal intensity diminished over time, as labeled cells disperse their fluorescent dye to daughter cells with each cell division. The median fluorescence intensity (MdFI) for each time point was normalized to its own initial MdFI and -log2-transformed for data analysis and visualization. Mean values are presented for each day (mean with SEM, two-way ANOVA). In line, labeled HuT78miR-141/200c cells presented lower MdFIs after two days as compared to HuT78empty cells. The upregulation of the miR-141/200c cluster in the respective cell lines and a comparison of their miR-141/200c expression to that of primary T-PLL and healthy donor-derived T cells are presented in Supplementary Figure S1a,b. Functional assessments upon miR-141/200c upregulation in the naïve, T-acute lymphocytic leukemia (T-ALL)-like cell lines are presented in Supplementary Figure S1c (MOLT-4) and S1d (SUP-T11).

