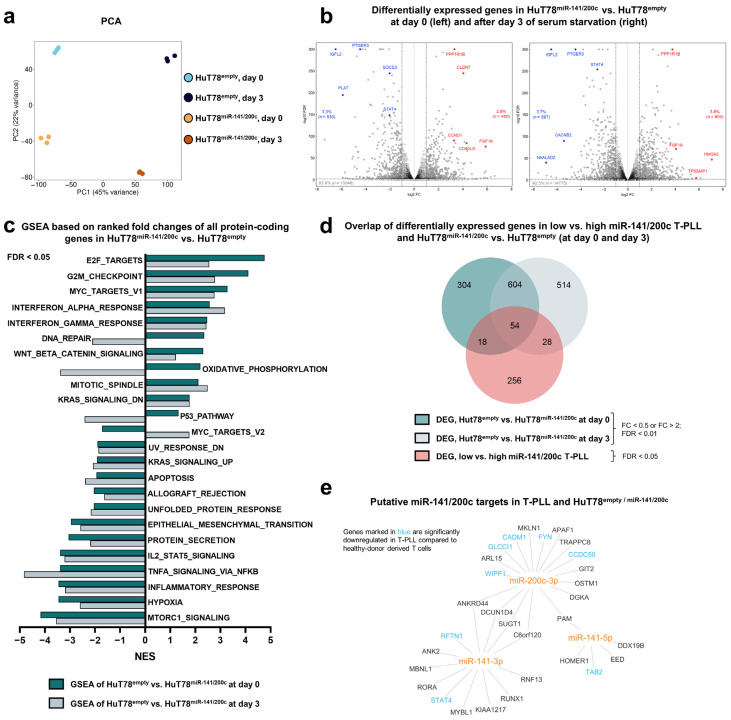
Figure 3.
Overexpression of miR-141/200c shapes a pro-oncogenic transcriptome of the mature T-cell lymphoma line HuT78, resembling alterations seen in T-PLL cases. Analyses of differentially expressed genes comparing HuT78miR-141/200c vs. HuT78empty cells, without serum starvation (day 0 (d0)) and after three days of serum starvation (RPMI + 1% FBS; d3). For each time point, three technical replicates were sequenced for each transduced cell line. (a) Principal component analysis (PCA) based on all mRNAs. Separate clustering of the four different conditions indicated global differences in the transcriptome, which were induced by upregulation of the miR-141/200c cluster (principal component 2, 22% variance) and by serum starvation (principal component 1, 45% variance). (b) Volcano plots of all expressed mRNAs comparing HuT78miR-141/200c vs. HuT78empty cells at d0 (left) and d3 (right). The horizontal dashed line indicates an FDR of 0.01. The black vertical dashed lines mark an fc of 0.5 and 2; the light grey vertical line marks an fc of 1. Exemplary genes are highlighted in blue (downregulation) or red (upregulation) [31,32]. (c) GSEA (HALLMARK gene sets), based on the complete list of fold changes of all protein-coding genes comparing HuT78miR-141/200c vs. HuT78empty cells (FDR < 0.05, Kolmogorov–Smirnov test). The dark green bars indicate differentially enriched HALLMARK gene sets at d0, and the light green bars indicate them at d3. (d) Venn diagram showing overlapping genes comparing HuT78miR-141/200c vs. HuT78empty cells at d0 and d3 (fc < 0.5 or fc > 2; FDR < 0.01), as well as the high miR-141/200c T-PLL subset vs. the low-miR141/200c T-PLL subset (FDR < 0.05). In total, 54 genes presented a differential expression in all three conditions. (e) Network of predicted targets (by seed sequences, see Section 2 for details), correlating negatively with miR-141/200c expression in miR-141/200c-modulated HuT78 cells and in T-PLL cells (p < 0.05, Spearman correlation). Font color represents a differential expression of miR/mRNA comparing T-PLL cells (n = 48 cases) and healthy donor-derived CD3+ pan-T cells (n = 6 donors; blue = lower expression; red = higher expression, based on our previously published RNA-seq data [6]). STAT4 emerges as a target of the miR-141/200c cluster. Heatmaps showing the top 50 differentially expressed genes comparing HuT78miR-141/200c vs. HuT78empty cells at d0 and d3, as well as heatmaps of core-enriched genes of exemplary HALLMARK gene sets are presented in Supplementary Figure S2. Differentially expressed genes and respective GSEAs upon serum starvation are displayed in Supplementary Figure S3. Supplementary Table S3 summarizes differential gene expression and deregulated GSEA pathways between HuT78empty and HuT78miR-141/200c cells at day 0 and day 3. Supplementary Table S4 summarizes differential gene expression and deregulated GSEA pathways at day 3 vs. at day 0 of serum starvation in HuT78empty or HuT78miR-141/200c cells.

