Figure 2.
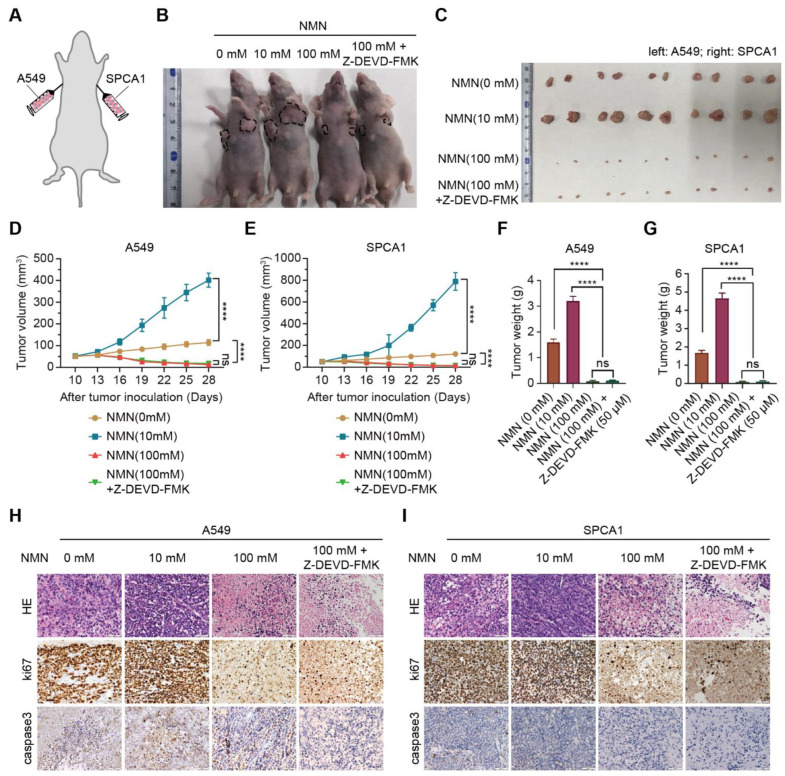
High-dose NMN inhibited lung adenocarcinoma growth in vivo. (A) Schematic representation of A549 and SPCA1 cells’ xenograft model. (B,C) Representative image of tumor-bearing BALB/C nude mice (B) and macroscopic image (C) of excised tumors in indicated groups. (D,E) Tumor growth curves of A549 (D) and SPCA1 (E) cells in indicated groups (n = 6). (F,G) Tumor weights of A549 (F) and SPCA1 (G) cells in indicated groups (n = 6). (H,I) Representative HE and immunohistochemistry staining of ki67 and caspase3 in A549 (H) and SPCA1 (I) tumor nodules; scale bar: 50 μm. **** p < 0.0001; ns, no significance.

